


INTRODUCTION
Endangered species are commonly subject to have limited genetic diversity in the population. Populations with low genetic variation are often less able to adapt to environmental changes, more susceptible to inbreeding, and at greater risk of local extinction (Frankham et al., 2010, 2014). For endangered species conservation, an understanding of the current effective population size (Ne), distribution of genetic variation within population and the history of population differentiation is required to assess genetic threats to population persistence (Di Santo et al., 2022). Next-generation sequencing (NGS) technology has revolutionized conservation biology by allowing the use of genomic data to address a genomic level of genetic variation and its association of the populational sustainability. This approach provides substantial opportunities to estimate genome-wide heterozygosity and genetic diversity with high accuracy, and to investigate broader factors affecting populational dynamics (Chung et al., 2023).
Hamabo mallow (Hibiscus hamabo Siebold & Zucc.; Malvaceae) is a small deciduous shrub with yellow flowers found in East Asia, such as Jejudo Island and Jeollanam-do in Korea, Ryukyu Island, Bonin Island, southern Honshu and Okinawa in Japan and the coast of Zhejiang Province in China (Fig. 1A, B) (Ahn, 2003; Ahn et al., 2003). Since Nakai (1914) described H. hamabo plants found on Jejudo Island, few studies on the native habitat of this species have been conducted (Kim, 2006). Because of habitat loss and fragmentation, the population number of H. hamabo has been dramatically reduced. It was designated as one of 52 protected wild plants by the Korean Ministry of Environment based on the ‘Enforcement decree of the natural environment conservation act’ in 2002. Hibiscus hamabo has been classified as a ‘vulnerable species’ (VU) until the year 2012 and currently as a ‘near threatened’ (NT) by the National Institute of Biological Resources (NIBR, 2012, 2021). The restoration projects of H. hamabo in Korea have been carried out several times by public and private organizations including a local administration and a botanical garden since 1997. Especially NIBR initiated restoration programs from Soando Island in the southern coastal area of the Korean peninsula and expanded the target areas into Jejudo Island, the biggest island in the southmost of Korea, in 2007, 2013, and 2017. As an allied species of Hibiscus syriacus L., which is the national flower of South Korea, and an indigenous species distributed in South Korea, H. hamabo has been spotlighted as an academic and ecological species of interest in the preservation of domestic native groups and the restoration of its historically known populations as well as the development of new habitats. Ahn et al. (2003) and Kim (2006) reported the possibility of the continuous reduction of population number and the risk of local extinction of H. hamabo in Korea based on the survey of its domestic distribution and ecological characteristics. Kim et al. (2007) conducted a direct investigation on genetic variation in H. hamabo Korean populations using a set of genetic markers, including internal transcribed spacer of nuclear ribosomal DNA and inter simple sequence repeats of the chloroplast genome. This study confirmed that genetic mutations within one group were significantly distinguished, but no other genetic variations were observed in the three other populations that were studied. It was the first report to provide useful information of genetic variabilities in H. hamabo Korean populations for restoration strategies, such as what individual or population to select for propagation, which remaining populations to be involved for restoration program. However, the genetic information in the first report needs further investigations because the analysis was conducted using limited genetic markers and focused only on 3 populations in Jejudo Island. Thus, it is necessary to develop genetic markers at the whole genome level and to increase the sampling sites in Jejudo Island and Soando Island where only restoration populations have remained after the native plants of H. hamabo were completely destroyed (NIBR, 2012).
In this study, we first identified genome-wide genotypes from 13 H. hamabo Korean populations with high-quality single nucleotide polymorphisms (SNPs) data via double digestion restriction associated DNA (ddRAD) sequencing and investigated the genetic structure and differentiation within and among populations. Finally, we will provide insights into the proper strategy for the selection of domestic populations for species conservation and restoration in the future.
MATERIALS AND METHODS
Sampling strategy
The sampling sites of plant materials were selected based on the information of herbarium specimens in NIBR and restoration sites addressed in previous news articles (Fig. 1C, Table 1). To extract genomic DNA about 5 leaves from each plant were collected during June and August. A total of 96 individuals were sampled, including 80 individuals in 11 populations from Jejudo Island and 16 individuals in 2 populations in Jeollanam-do. 70–80 mg of wet leaf tissue was used to extract genomic DNA with DNeasy Plant Mini kit (Qiagen, Hilden, Germany). The extraction protocol provided by the company was used and each gDNA extract was quantified using a Nanodrop Lite spectrophotometer (Thermo Scientific, Waltham, MA, USA) to measure the purity and concentration.
ddRAD sequencing for genotyping
The preparation of NGS library for RAD-seq and following procedures for sequencing were done with the commercial service (Seeders Inc., Daejeon, Korea). Here, we briefly summarize the library preparation and sequencing procedures. To prepare the RAD-seq library each gDNA was first digested with restriction enzymes, Pst I (5′-CTGCA/G-3′) as a rare cutter and Msp I (5′-C/CGG-3′) as a frequent cutter and the whole fragmented DNA was continued to be applied for adapter ligation using company provided barcoded adapters (Pst I cut site) and unbarcoded adapter (Msp I cut site). All DNA fragments with adapters were pooled and amplified with universal Illumina primers to attach sequencing adapters and sequenced in Illumina platform of ‘HiSeq X ten’ by the commercial service from the company, Seeders.
SNP calling, filtering, and marker classification
High-throughput short-read sequencing data obtained from Illumina sequencing (San Diego, CA, USA) were demultiplexed to separate barcoded sequences for each sample and processed for further analysis. Demultiplexing of raw Illumina sequences was carried out using process_radtags pipeline implemented in the software Stacks versions 2.60 (Catchen et al., 2013) with the filtering option of PHRED scores ≥ 30. All reads identified into each individual were assembled by a denovo_map in Stacks with default options except for the values of options, M = 2 and n = 2, that optimized with R80 methods (Appendix 1, Online Supplementary Materials) (Paris et al., 2017; Rivera-Colón and Catchen, 2022). Using the program populations implemented in Stacks, we built a genotype matrix applying with filtering options; removing SNP loci with minor allele frequency less than 0.05, keeping SNP loci determined by more than 12 populations (p = 12), and retaining SNP loci with more than 80% of individuals in each population (r = 0.8). The genotype matrix was further processed using vcftools for filtering VCF files with missing data < 5%, mean depth > 30 options (Danecek et al., 2011). The final genotype matrix in a VCF format was converted into the different type of matrix format with PGDSPIDER version 2.1.1.5 (Lischer and Excoffier, 2012) to use for additional analysis described in the next section.
Genetic diversity and population structure
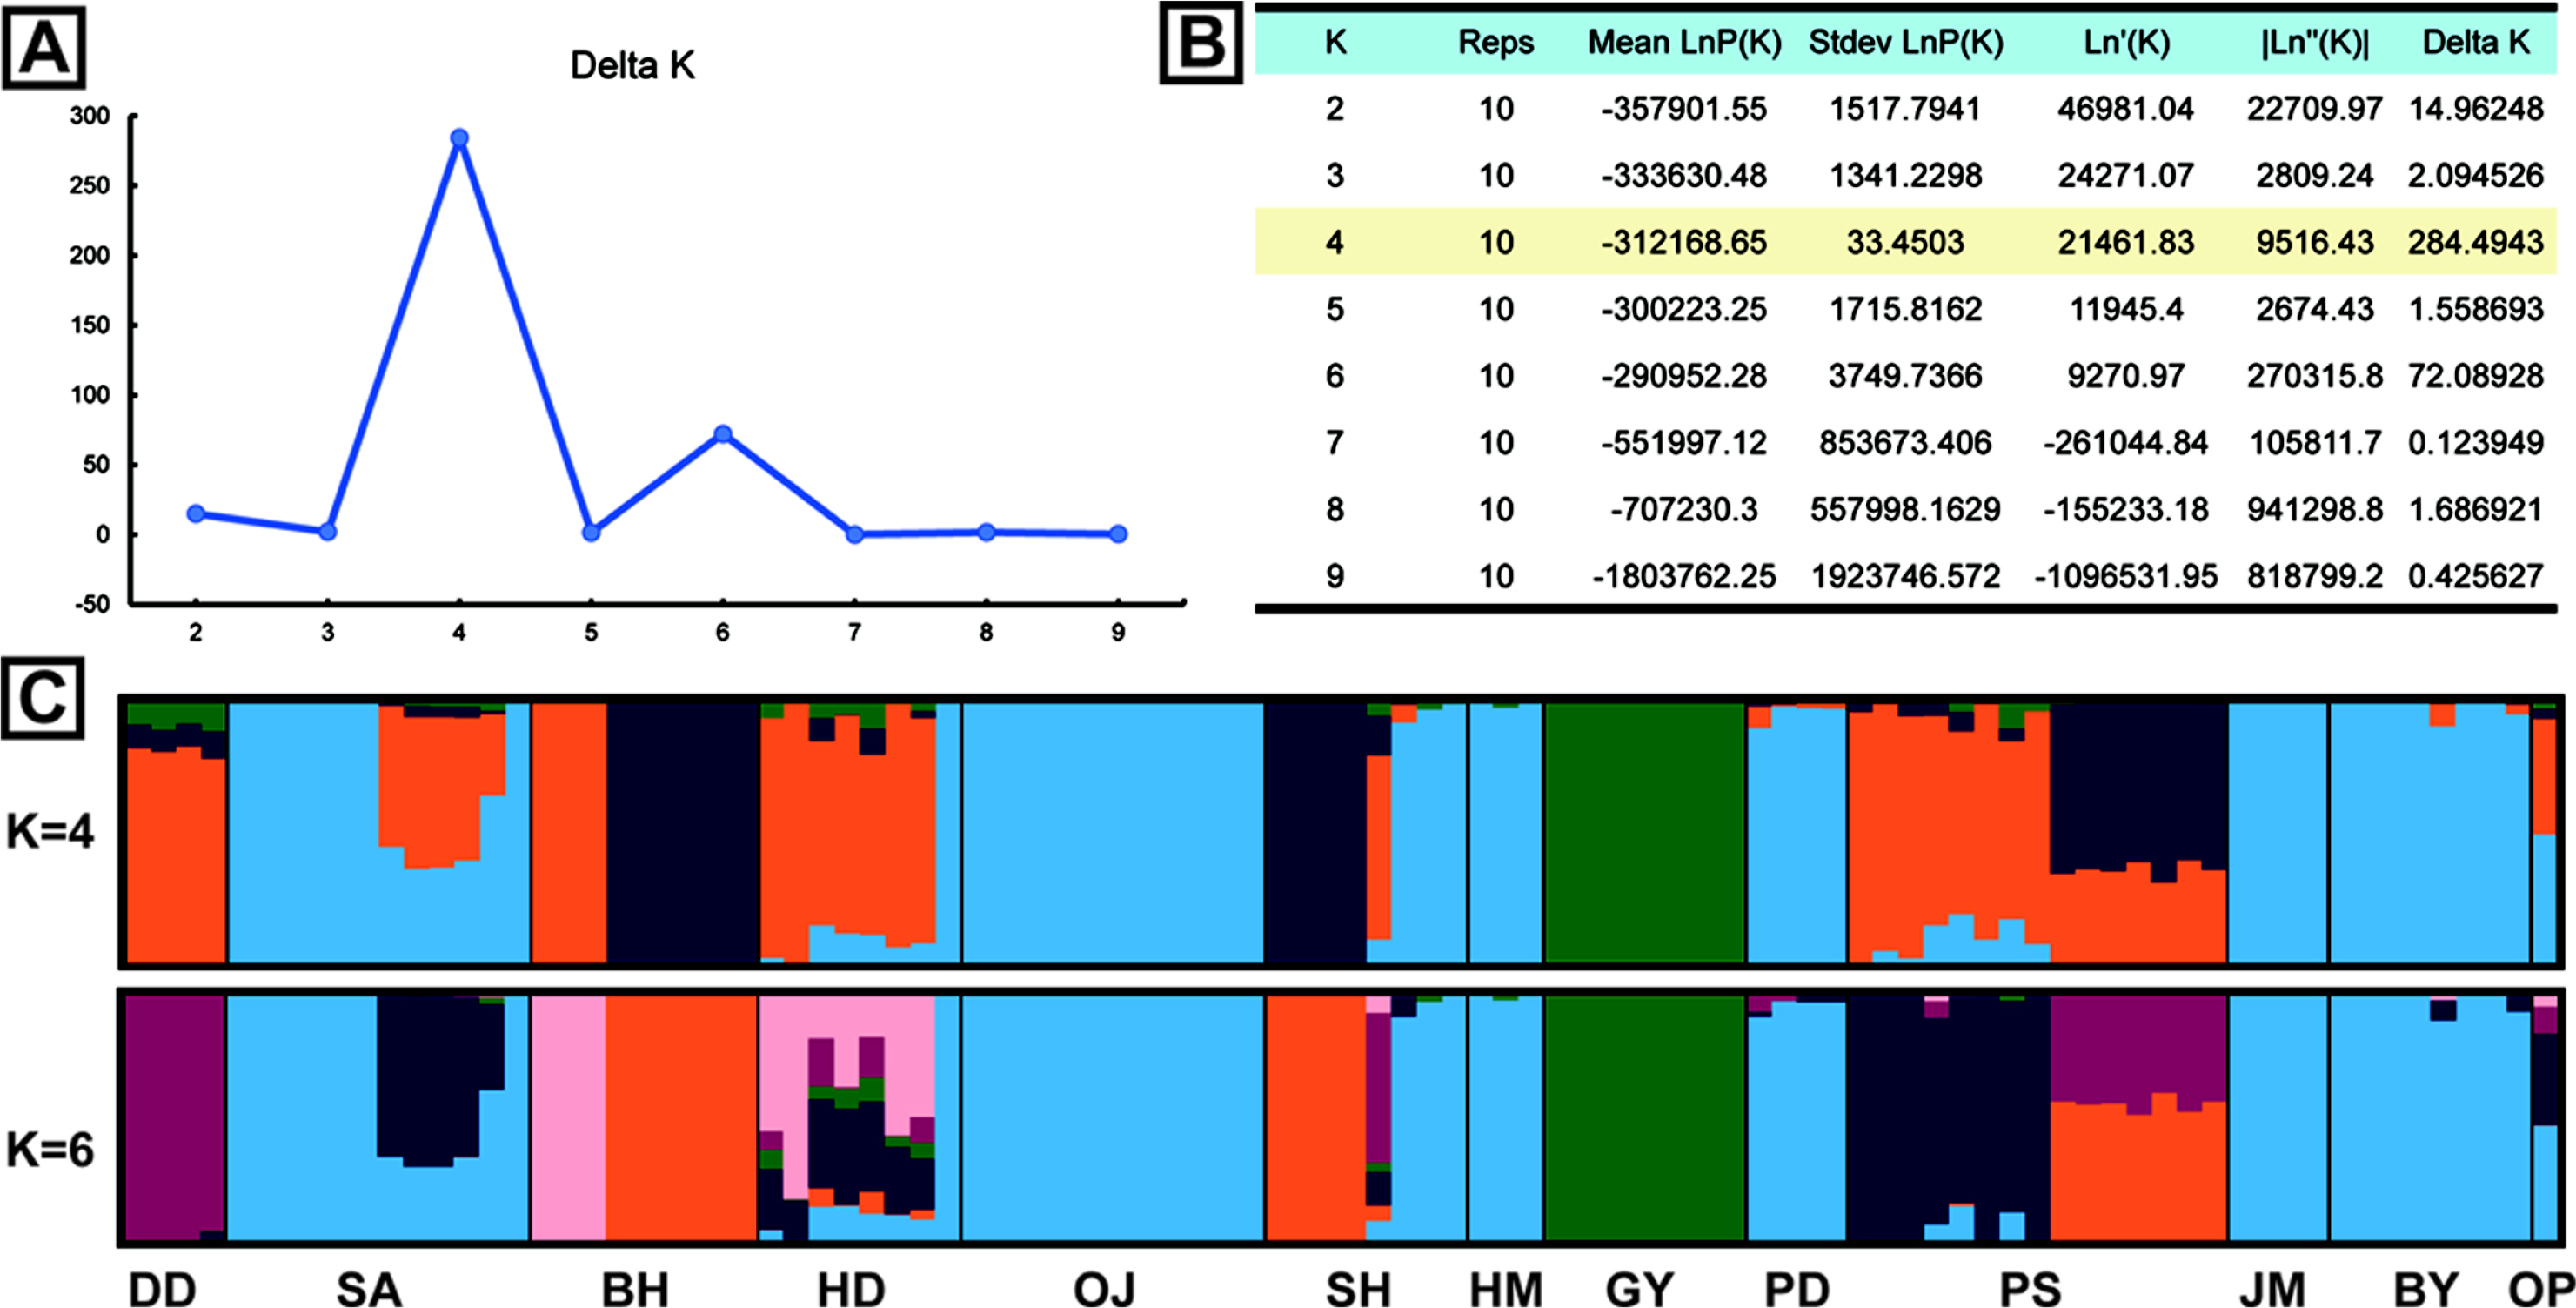
First, we estimated genetic statistics including the level of heterozygosity and homozygosity in each individual and within population using populations program implemented in Stacks. Also, the nucleotide diversity (π) and Wright’s F-statistics (FIS, FST) were calculated using the populations for each population separately. Genetic differentiation between populations was tested by analysis of molecular variance (AMOVA) using Arlequin version 3.5 (Excoffier and Lischer, 2010). The Mantel test was used to estimate correlations between geographic distance and genetic distance (FST) using GenAlEx version 6.51 (Peakall and Smouse, 2012). SNPs data were analyzed in the STRUCTURE version 2.3.4 (Pritchard et al., 2000) to infer the populational genetic structure with model-based clustering methods. To determine the most probable number of clusters (K value) 10 times of 100,000 Markov Chain Monte Carlo iterations after burn-in 10,000 generation for predicted cluster numbers from K = 1 through K = 10 were conducted in STRUCTURE with the allowance of admixture (Evanno et al., 2005). STRUCTURE HARVESTER (Earl and vonHoldt, 2012) and StructureSelector (Li and Liu, 2018) were used to determine the most probable number of clusters. With the optimized number of K, the data set was fully analyzed with 1 million Markov chain Monte Carlo iterations after removing 100,000 generations as a burn in. A principal component analysis (PCA) was conducted to find genetic clustering with populations using R packages SNPRelate (Zheng et al., 2012). To estimate the phylogenetic relationship of individual samples we built the neighbor-joining (NJ) tree by calculating the genetic distance based on Jukes-Cantor method and branch supports were tested with 1,000 bootstrapping in MEGA 11 (Tamura et al., 2021). The NJ tree were visualized and modified using Figtree version 1.4.4 (http://tree.bio.ed.ac.uk/software/figtree/).
RESULTS
From the ddRAD-sequencing, we obtained a total of 103,463,613,896 bp (685,189,496 reads) sequence data from all 96 H. hamabo samples. After demultiplexing with barcode sequences, an average of 6,205,986 reads was identified per each sample (86.95% of total reads). Using SNP data set after de novo assembly and filtering, we determined 3,352 SNP loci for 96 individuals from 13 populations. In this study, we excluded the OP population from Jejudo Island for most of populational level of analyses because there is only one sample in the population.
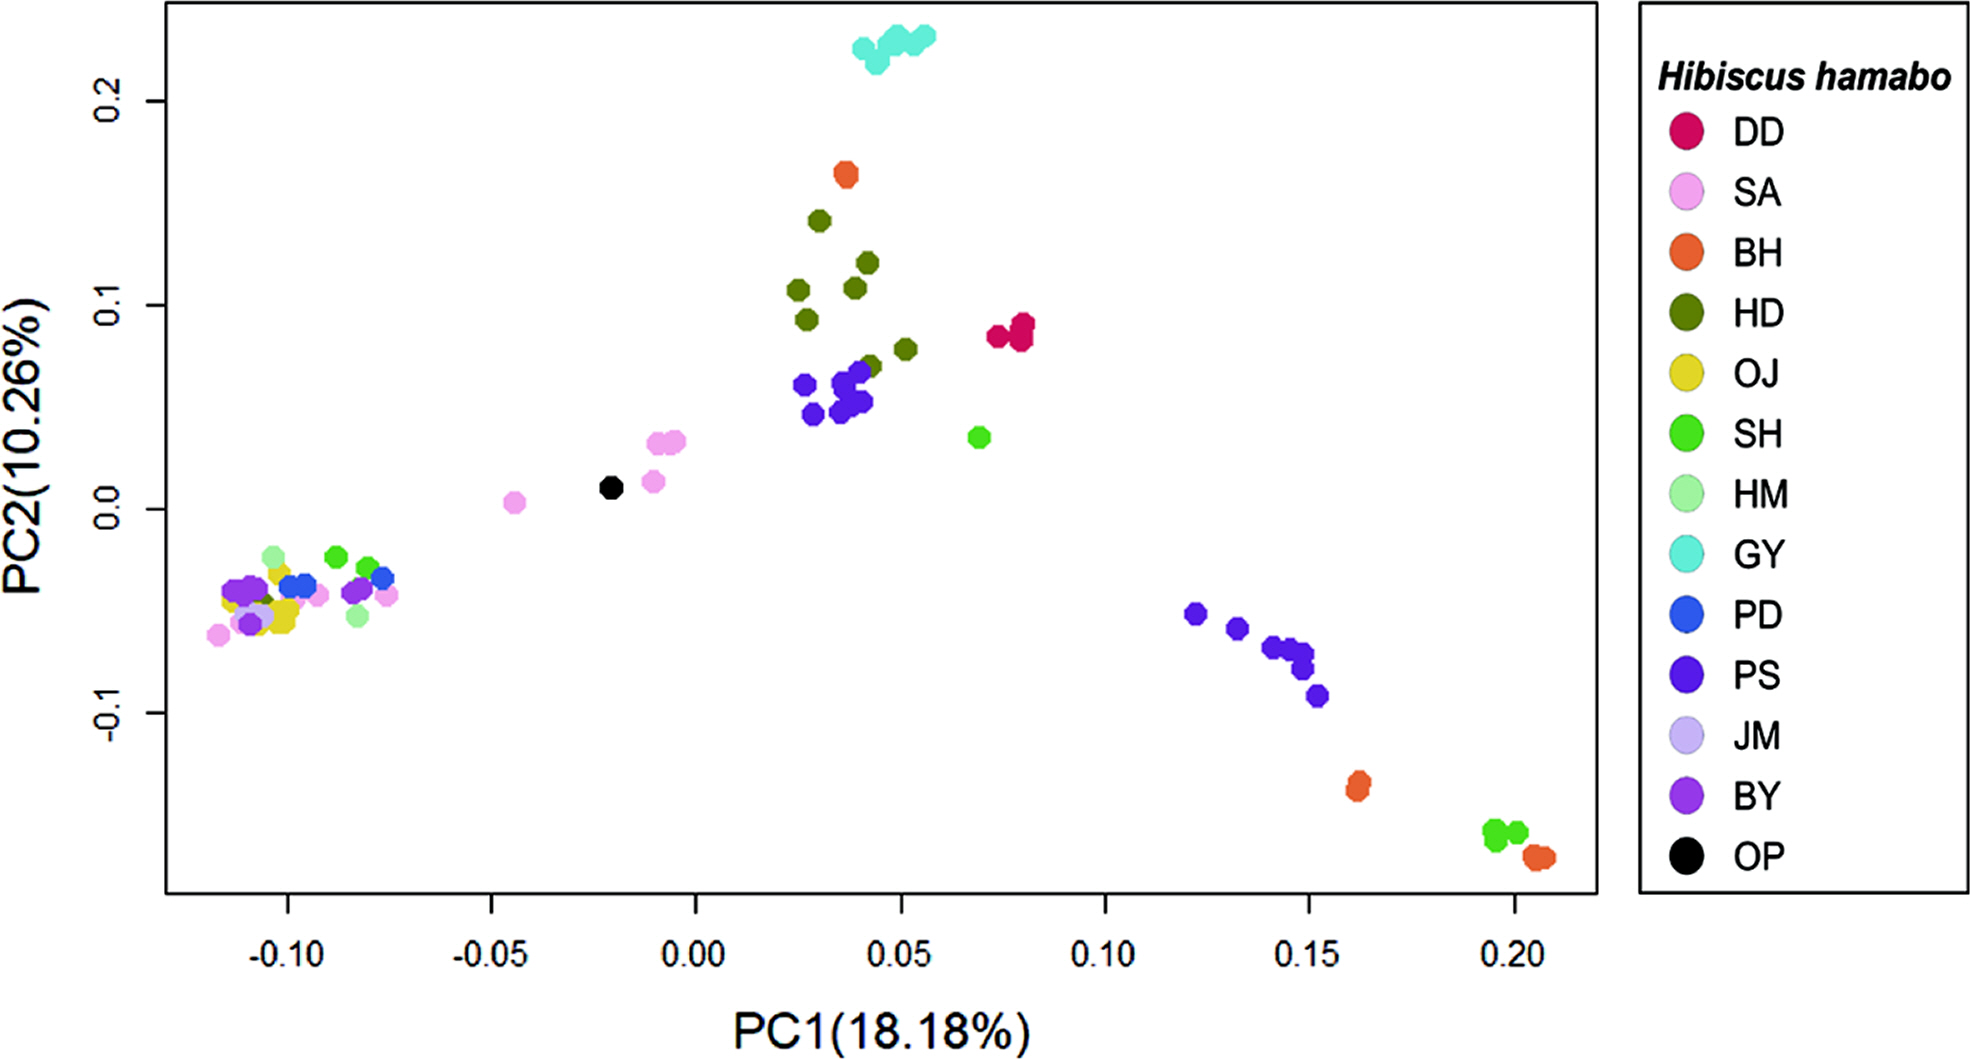
The results of genetic diversity for the 12 populations were summarized in Table 2. The average nucleotide diversity (π) was 0.260 (0.177 {population GY} ~ 0.340 {population HD}). The observed heterozygosity (Obs Het) ranged from 0.172 to 0.299 (mean = 0.235), and the expected heterozygosity (Exp Het) from 0.170 to 0.319 (mean = 0.240). The average inbreeding coefficient (FIS) was 0.093 (minimum = –0.158 and maximum = 0.287). The negative values of FIS were observed from populations, DD and GY, and the highest value was from the population SH (Table 2). The level of genetic differentiation among populations was estimated by calculating the pairwise FST scores (Table 3). To obtain the pairwise FST among populations all SNP loci were initially tested whether each locus is significantly different between two populations (Fisher’s p < 0.01) and selected significant SNP loci were used for global estimation of the pairwise FST. The FST scores between GY and other populations were relatively higher than any other pairs and the highest FST score was estimated between populations GY and DD (FST = 0.305). On the other hand, there appeared that populations SA and PD were the least differentiated (FST = 0.009). The pairwise FST scores between SA and some urban populations such as HM, PD, JM, and BY were relatively low, suggesting possible similar origin of tree seedlings for conservational transplanting. To see if there is a correlation between genetic distance with FST estimations and geographic distance, we used a Mantel test to evaluate the significance. The coefficient of determination (R2) converges to 0 (0.0654), which confirms that the geographic distance and populational differentiation were not clearly relevant (Appendix 2, Online Supplementary Materials). The result of AMOVA analysis was summarized in Table 4. The genetic variation found within individuals showed 66.82% of total genetic variation, while that among populations was 26.14%. Only 7.04% of the total genetic variations were found among individuals within populations. To understand the admixture pattern among H. hamabo Korean populations, we first determined the number of genetic clusters using the STRUCTURE analysis. With an allowed admixture model, we found that the most optimal number of clusters was K = 4 by the hierarchical likelihood test (Fig. 2A, B). Under the assumption of K = 4, individuals from five populations (OJ, HM, PD, JM, and BY) strongly shared genetic ancestry (Fig. 2C), which is consistent with the populational differentiation presented with FST scores (Table 3). Individuals from the population GY showed a monotypic ancestry and individuals from other populations showed fair amount of admixture of ancestry (Fig. 2C). Because the second optimal K number estimated was 6, we also visualized the admixture pattern with K = 6 to investigate the possible change of admixture patterns. In general, the admixture pattern in currently investigated populations was variously maintained with complex ancestry with an exception that individuals from the population DD were merged into a monotypic ancestry (Fig. 2C). Moreover, genetic structure of individuals from our population was tested by PCA. The first three principal components explained 36.17% of eigenvalues (PC1 = 18.18%, PC2 = 10.26%, and PC3 = 7.73%) (Fig. 3, Appendix 3, Online Supplementary Materials). Consistent with STRUCTURE analysis, individuals from five populations (OJ, HM, PD, JM, and BY) were strongly clustered. Individuals from two populations (DD and GY) showing monotypic ancestry were also strongly clustered (Fig. 3). A phylogenetic relationship was estimated from the NJ tree reconstruction and the populational relationships were suggested similar to clustering patterns in STRUCTURE and PCA results (Appendix 4, Online Supplementary Materials).
DISCUSSION
In this study, we generated high-throughput NGS genome data using ddRAD-seq strategy and determined 3,352 SNPs loci with 96 individuals collected from 13 Korean populations. It is the first study of genome-level genotyping for Korean H. hamabo. We covered most populations known as original natural habitats and restored sites in this study.
Because the restoration activities of H. hamabo have been carried out for more than 20 years it was technically difficult to discern each tree whether it is a natural or cultivated individual. Although some individual plants found in a roadside and a garden area were obvious to be considered as cultivated ones, we could not completely decide the origin with those collected in the coastal area. The nucleotide diversity (π) that simply quantify the genetic variation in each population ranged from 0.177 to 0.340 (Table 2). Kim et al. (2007) reported the genetic diversity based on nrITS sequence data with three populations (SH, OJ, and HD) that also included in our study. They found that the genetic diversity of population HD was relatively higher than other two populations and suggested that preserving HD population might be important for conservation strategy. Consistently, the genetic diversity of HD population (π = 0.340) was the highest in our study, which suggested that this population seems to be properly maintained with high genetic variation.
The FST is one of the important indicators for detecting genetic differentiations among populations (Weir and Cockerham, 1984). We estimated the populational differentiation by calculating FST scores on each SNP locus between every pair of populations and selecting significant loci with Fisher’s Exact Test (p < 0.05). The mean of significant FST scores among populations was used as an overall FST scores to discuss more details (Table 3). The FST scores estimated in this study were variable and some of them showed over 0.15 suggesting that some H. hamabo populations are genetically differentiated. The average FST score was 0.261 and this result is consistent with the AMOVA analysis showing the variance among populations accounted for 26.14% of the total variance. The pairwise FST scores between GY and other populations were relatively higher than other pairwise scores, which indicates that the GY population is genetically distinct from other populations. Similarly, our STRUCTURE analysis also suggested that the ancestry of GY is the most unique from other populations (Fig. 2). Furthermore, individuals from GY are clearly grouped in PCA (Fig. 3). The habitat of the population GY is a typical coastal area composed of basalt rocks and we observed about a hundred of H. hamabo plants with various ages during our fieldwork. Probably there appears lots of progenies germinated from seeds in the site. With the evidence of genetic variability and natural propagating status in GY population, we propose to keep this site as a source for an ex-situ conservation and to monitor the area with a long-term plan to obtain the ecological information. On the other hand, the average pairwise FST scores among five populations (OJ, HM, PD, JM, and BY) was 0.047, indicating a low differentiation between these populations. The populations, OJ, HM, PD, and JM are clearly cultivated sites as plants were found along the roadside for ornamental purposes. In addition, the BY population was previously known as a native habitat, but was restored once after a total damage of the site. Thus, these 5 populations seemed to be restored by transplanting individuals propagated from a specific source of germplasms, which showed a founder effect with low genetic differentiation on these populations. Moreover, we found only one individual plant from the population OP where Kim (2006) reported about 50 living individuals, which seems to be close to experience the regional extinction. Therefore, it seems necessary to investigate and restore the OP population.
The alert to the possible local extinction of Korean H. hamabo was officially emerged by designating it as an endangered species in 1998 followed by listing it as one of the ‘wild animals and plants for special care’ in 1989 by the Korean Ministry of Environment. The main rational to recognize H. hamabo in Korea as an endangered species was based on the long-term observation of broad range of habitat losses and population reduction due to anthropogenic activities in known distribution areas. Since the first scientific report (Nakai, 1914) on plants found in Jejudo Island, the ecological survey on the known habitats and the access of the level of genetic variation of H. hamabo in Korea have been highlighted by several studies (Ahn et al., 2003; Kim, 2006; Kim et al., 2007). Because seeds are usually spread by the ocean currents, H. hamabo populations are mainly located on the coastal area. Fast habitat destructions due to the reclamation and frequent coastal road installations have influenced population reduction and increased the risk of the local extinction of H. hamabo in recent years (Nakanishi et al., 2004; Kim, 2006). So far, considerable number of conservation projects of H. hamabo for the population restoration and horticultural usages such as roadside trees and gardening have been carried on by governmental administration and non-profit organizations (Korea National Arboretum, 2021). For the successful restoration, one of the most important considerations will be how we can introduce genetic diversity for future sustainability as well as maintain population stability. For this purpose, the global quantification of genetic variations in target plant populations and follow-up monitoring of restored populations are very important.
There is an opinion that the species, H. hamabo should be lowered the conservation status into the Least Concern (LC) because it is relatively common in neighboring countries especially in Japan (Chang et al., 2005; Kim et al., 2008). Although it was not included in the national vascular plants red list in Japan, the Japanese H. hamabo has been considered as a species exposed to the risk of regional extinction (Nakanishi, 2001) and 17 out of 20 prefectures have evaluated H. hamabo as a species of NT or higher level of conservation categories (Nakanishi, 2010). Therefore, even if the Korean H. hamabo is lifted to an endangered wildlife status II from the Ministry of Environment, it is judged that attention should be paid to this species steadily by keeping it listed in the Red Data book by the NIBR category above NT. Finally, to understand the origin of the Korean H. hamabo extended sampling including Chinese and Japanese plants will be required for the future research.