


It is generally known that geographic isolation is one of the main factors shaping the genetic structure of plant populations (Smith, 1999; Hamilton and Eckert, 2007; Yamada and Maki, 2012). Physical isolation of populations, either natural (e.g., mountains, valleys, rivers, lakes, and glaciers) or human-caused (e.g., highways, channels, and walls) are discontinuities of suitable habitat that may restrict or prevent gene flow, eventually leading to strong genetic differentiation between isolated populations (Slatkin, 1987; Le Corre et al., 1997; Su et al., 2003; Zhang et al., 2007; Landguth et al., 2010). As shown in some empirical studies, such differentiation can be attained just after a few generations, sometimes with no need of huge physical barriers; a classical example is the Great Wall of China, whose barrier effects are genetically detectable after just six centuries (Su et al., 2003). In South Korea, the construction of roads, coupled with the establishment of new villages and the expansion of paddy fields have led to significant increases in genetic differentiation in island populations of the terrestrial orchid Cymbidium goeringii in less than two centuries (Chung et al., 2014c).
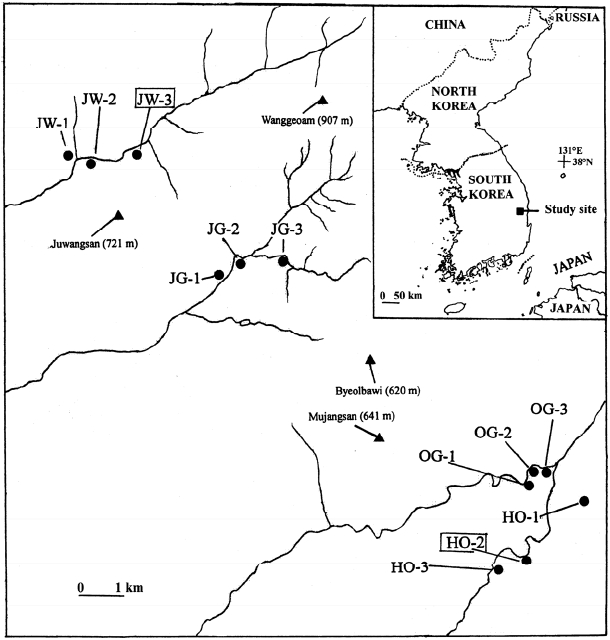
Juwangsan National Park (JNP), one of the 22 national parks of South Korea, is located in a mountainous branch of the Baekdudaegan (the so-called Nakdongjeongmaek Range), in the southeastern corner of the Peninsula (Fig. 1). The park, as well as some surrounding areas, are largely made of volcanic ash tuffs ca. 70 Ma old, with many vertical cliffs in canyons and deep valleys originated by erosion of volcanic rocks (Hwang et al., 2007) that deeply dissect the landscape. Thus, this region constitutes a natural laboratory to test the effects of barriers on population divergence. We have selected an area of ca. 250 km2 that contains four valleys separated by mountain ranges; two valleys, Juwang and Jeolgol, are located within JNP, whereas Okgye and Haok valleys are in its vicinity (Fig. 1). As one may expect, in this region some plant species are restricted to valleys whereas others are distributed rather continuously (ca. 15 km range) (Fig. 1). For example, Hylotelephium ussuriense (Kom.) H. Ohba (≡ Sedum ussuriense Kom.) is found only in the four valleys but does not occur in the mountains in between (Ku et al., 2011). In contrast, Sedum kamtschaticum Fisch. & C. A. Mey. co-occurs in the four valleys but also on the intervening mountains in JNP and its vicinity. To understand better the effects of physical isolation on the genetic structure of plant populations in the study area, recently we comparatively assessed genetic variability and structure in 12 population pairs (three sympatric populations per valley for each species) of the two stonecrops (Chung et al., 2014b). The authors found high and comparable levels of within-population genetic variation for the two species, although among-population difference was significantly higher in H. ussuriense than in S. kamtschaticum (FST = 0.261 vs. FST = 0.165). In addition, the former exhibited a much higher percentage of among-valley variation (19%) than the latter (4%).
As plant congeners usually share similar life-history traits, in particular breeding systems and seed dispersal mechanisms, comparisons of congeneric species pairs allow for partial control of “background variation” (or “phylogenetic inertia”) caused by different life-history traits (Karron, 1987, 1991, reviewed in Godt and Hamrick, 2001). With this in mind, we selected Sedum polytrichoides Hemsl., an additional stonecrop that is also present in the study area, to get additional insights into the previous results by Chung et al. (2014b). The species is somewhat common along the four valleys, but several populations also occur on rocks in mountains and hillsides between valleys. The three species are insect-pollinated (Ku et al., 2011; Chung et al., 2014b; M. Y. Chung, pers. obs.), and we assumed that their seed dispersal mechanisms would be similar.
Given the current occurrence patterns of the three stonecrops, the high habitat specificity, and the isolated nature of the valleys, we expect an increase of genetic differentiation in the following order: H. ussuriense, S. polytrichoides, and S. kamtschaticum. In particular, we expect that the pattern and degree of among-population differentiation of S. polytrichoides will be more similar to those found in H. ussuriense rather than S. kamtschaticum. To test these predictions, we used allozymes as genetic markers to estimate levels and structure of genetic diversity in JNP and its vicinity. If our predictions are supported, this study also would be a reference for emphasizing the importance of physical barriers for generating among-population genetic structure even at very small scales.
Materials and Methods
Study species
Sedum polytrichoides has 5–10 cm high stems, and inflorescences contain many small bright yellow flowers, visited by unidentified insects (M. Y. Chung and M. G. Chung, pers. obs.). Members of Sedum are known to be pollinated by a variety of insects, such as bees, flies, and butterflies, and both outcrossing and mixed mating have been reported (Wyatt, 1983; Priya, 2007). It usually grows in small crevices on rocks in medium-elevation mountains (ca. 1,000 m a.s.l.) in northeastern and eastern China, Japan, and Korea (Ohwi, 1965; Fu and Ohba, 2001). As a member of the temperate vegetation in Korea, it occurs relatively sparsely in mid-elevation mountains across the Peninsula. Within the study area, as stated above, S. polytrichoides is mainly restricted to the four valleys rocky cliffs, although a few populations occur in between.
S. kamtschaticum has 5–30 cm high stems with bright yellow flowers (5–6 mm in diameter) that also attract insects. The species is widely distributed in Far East Asia, spanning Kamchatka, Ussuri, Kuriles, Sakhalin, the Japanese Archipelago, northern China, and the Korean Peninsula (Ohwi, 1965). On the Korean Peninsula, S. kamtschaticum is relatively common on rocks in mountains and hillsides; within the study area, it is a common plan, and rather continuously distributed.
H. ussuriense has 10–25 cm high stems, that carry many small magenta pink flowers (5–6 mm in diameter) that are visited by insects (Ku et al., 2011). The species is disjunctly distributed in two areas: in JNP and its vicinity (but only in the small crevices of steep cliffs along the four valleys) and along the Tumen River (i.e., in the boundary between China, North Korea, and Russia) and the basin of the Ussuri River in Russia, over 700 km north (Ku et al., 2011).
Population sampling
We collected samples from 10 populations of S. polytrichoides (n = 243 samples) (Table 1) at the same sites studied by Chung et al. (2014b) with the exception of two populations (JW-3 and HO-2) in JNP and its vicinity (Fig. 1). We chose one sample from tufted stems to prevent sample duplicates. To minimize the damage to these plants, we cut just 2 cm from the tip of one shoot.
Enzyme electrophoresis
We extracted enzymes using a phosphate-polyvinylpyrrolidone buffer (Mitton et al., 1979) and conducted electrophoresis on 13% starch gels. We resolved eight enzyme systems with two buffer systems. With a modification (Haufler, 1985) of the system 6 of Soltis et al. (1983), we resolved diaphorase (Dia-1, Dia-2), fluorescent esterase (Fe), leucine aminopeptidase (Lap-1, Lap-2), malic enzyme (Me), phosphoglucomutase (Pgm-1, Pgm-2), and triosephosphate isomerase (Tpi-1, Tpi-2). Using the morpholine-citrate buffer system (pH 6.1) of Clayton and Tretiak (1972), we further resolved isocitrate dehydrogenase (Idh) and 6-phosphogluconate dehydrogenase (6Pgd). We followed stain recipes from Soltis et al. (1983) except for diaphorase (Cheliak and Pitel, 1984). We designated putative loci sequentially, with the most anodally migrating isozyme designated as 1, the next 2, and so on. We also designated different alleles within each locus sequentially by alphabetical order (a, b, c, d).
Data analysis
We considered a locus to be polymorphic when two or more alleles were observed, regardless of their frequencies. We estimated the genetic diversity parameters within populations using the programs POPGENE (Yeh et al., 1999) and FSTAT (Goudet, 1995): percentage of polymorphic loci (%P), mean number of alleles per locus (A), allelic richness (AR) corrected by minimum sample size (n = 11 in JGP-1) (Table 1), observed heterozygosity (Ho), and Hardy-Weinberg (H-W) expected heterozygosity or Nei’s (1978) gene diversity (He). Except for AR and Ho, these parameters were also estimated for the total samples as a whole (i.e., the species level).
To test for recent decreases in effective population size (bottlenecks), we evaluated differences across loci between the H-W He and the equilibrium heterozygosity (Heq) expected assuming mutation–drift equilibrium. H-W He is not very sensitive to the fate of low frequency alleles, whereas Heq is relatively sensitive to population bottlenecks, and declines as a result of the loss of such alleles. These differences (He – Heq calculated for a number of independent loci) were evaluated using a sign test and a Wilcoxon sign-rank test under an infinite allele model using the program BOTTLENECK (Piry et al., 1999). Since allelic diversity is generally lost more rapidly than He (Nei et al., 1975), recently bottlenecked populations will exhibit an excess of H-W He relative to Heq (Cornuet and Luikart, 1996).
We used the program SPAGeDi (Hardy and Vekemans, 2002) to calculate population-level FIS (inbreeding) and its significance level by 999 permutations under the null hypothesis of FIS = 0. To measure deviations from H-W equilibrium at each polymorphic locus, we calculated averages of Wright’s (1965) FIS and FST (deviations from H-W equilibrium of individuals relative to their local populations and local populations relative to the total population, respectively) following Weir and Cockerham (1984). We determined the significance of multi-population FIS and FST estimates by a permutation test (999 randomizations of alleles among individuals within samples and 999 randomizations of genotypes among populations, respectively). These calculations were also performed using FSTAT (Goudet, 1995).
To test for the influence of individuals within populations, populations within and among valleys, and populations within each region (considering Juwang and Jeolgol valleys as the “northern region,” and Okgye and Haok valleys as the “southern region”; Fig. 1) on the observed genetic variation, we conducted an analysis of molecular variance (AMOVA) for each species using the program GenAlEx 6.5 (Peakall and Smouse, 2006).
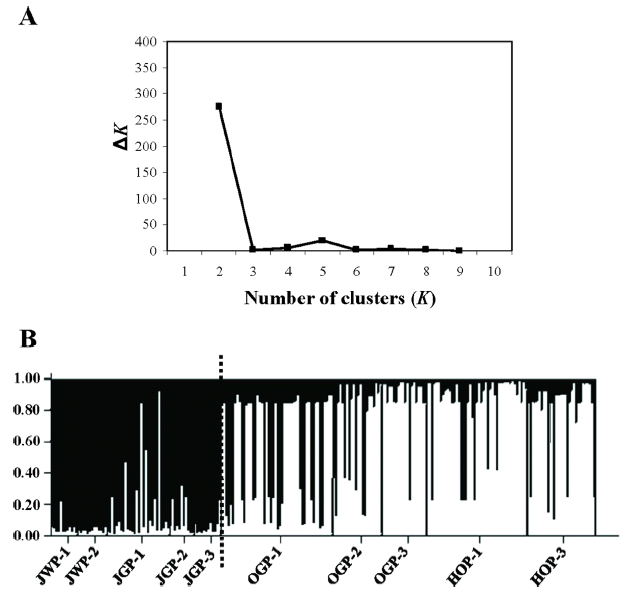
Genetic structure among populations was assessed by means of the Bayesian algorithm implemented in STRUCTURE 2.3.4 (Pritchard et al., 2010). The program estimates the likelihood of the individuals being structured in a given number of genetic clusters (or genetic populations, K). The admixture ancestry model with correlated allele frequencies was selected as the most appropriate option for the analysis. The burn-in period and Markov Chain Monte Carlo (MCMC) were set to 50,000 and 500,000 iterations, respectively, and 10 replicates per K were run. The most likely value of K was determined both choosing the smallest K after the log probability of Pr(X|K) values reached a plateau (Pritchard et al., 2010) and by the ΔK statistic of Evanno et al. (2005), with the aid of STRUCTURE HARVESTER (Earl and vonHoldt, 2012).
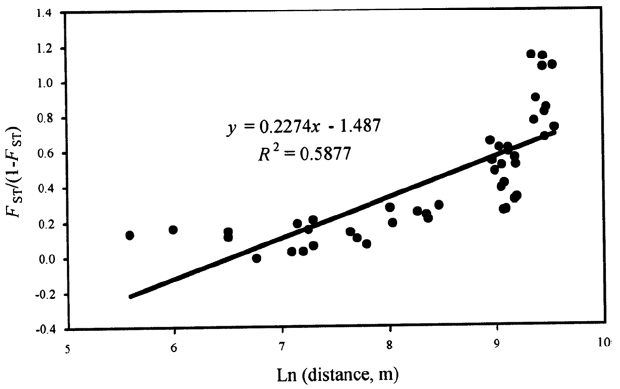
To test the overall pattern of genetic structure at the regional scale (i.e., isolation-by-distance effects), we conducted a Mantel test (Mantel, 1967) with 999 replicates, between all pairwise FST/(1 – FST) (FST was calculated following Weir and Cockerham, 1984) and the corresponding logarithm of pairwise geographic distances (Rousset, 1997) under the null hypothesis of no spatial genetic structure (regression slope, β = 0).
Results
Genetic diversity
Nine of the 12 putative loci surveyed for S. polytrichoides were polymorphic (Table 2). As a result, moderate levels of average within-population genetic variation were found (%P = 37.5, AR = 1.40, A = 1.43, and He= 0.112) (Table 1). When the samples were pooled, we found higher levels of genetic variation owing to among-population genetic component (Table 1). We did not find significant indication of recent bottlenecks in all population of S. polytrichoides (data not shown).
Inbreeding and population genetic structure
Except for OGP-2, population-level FIS estimates in the remaining nine populations were significantly positive at the 0.05 level (Table 1). These results, as well as the significant multi-population-level FIS (FIS = 0.331, p = 0.001) (Table 1), indicated a substantial deficit of heterozygotes within populations of S. polytrichoides.
Deviations from H-W expectations due to allele frequency differences between populations were significant and moderate (FST = 0.250, p = 0.001). The results of AMOVA revealed that variation among the four valleys was larger than that found among populations within individual valleys (19% vs. 9%) (Table 3). A higher between region (i.e., northern valleys vs. southern valleys) component was found compared to among populations within regions (24% vs. 11%) (Table 3). A putative stronger barrier was found between the two northern valleys (10%), whereas there was a very weak barrier between the two southern valleys (2%) (Table 3).
We inferred two gene pools (K) both by the “plateau” (Pritchard et al., 2010; results not shown) and the Evanno et al. (2005) methods (Fig. 2A): most individuals from northern valleys belonged to one cluster whereas most individuals from the southern valleys belonged to the alternative cluster (Fig. 2B), and such pattern of distinctiveness between northern and southern valleys was maintained at higher K values (data not shown).
We found a significant correlation between pairwise genetic differentiation estimates and their corresponding logarithm of pairwise geographic distances (r = 0.767, p = 0.001) (Fig. 3), suggesting that populations are at regional equilibrium of gene flow and drift across JNP and its vicinity.
Discussion
Genetic diversity and inbreeding
Levels of within-population genetic diversity of S. polytrichoides are slightly lower compared to S. kamtschaticum and H. ussuriense (Table 1). These levels of genetic diversity are, however, still higher than the reference values for populations of short-lived herbaceous perennials (means %P = 28.0, A = 1.40, He= 0.096) (Hamrick and Godt, 1990) and plant species with mixed-animal breeding system (means %P = 29.2, A = 1.43, He= 0.090) (Hamrick and Godt, 1990). However, although the review by Hamrick and Godt (1990) has been often cited for species comparison, we have to note that only 28% of the variation for levels of genetic diversity at the population level is explained by life-history traits.
Moderate levels of genetic variation in S. polytrichoides are compatible with an scenario of demographical stability, as this decreases the likelihood of loss of genetic variation through drift (Barrett and Kohn, 1991; Charlesworth et al., 2003). The results of BOTTLENECK indicate the absence of genetic bottlenecks within approximately the past 2Ne–4Ne generations (Ne, effective population size) (Piry et al., 1999), suggesting that size of populations has been somewhat stable in JNP and its vicinity in recent times. Populations of S. polytrichoides would have maintained relatively large sizes even during the LGM, given that the Baekdudaegan and some of its branches, such as the Nakdongjeongmaek (where the study area is located) (Fig. 1), have been suggested to harbor large refugial areas on the basis of both genetic and paleoecological data; Chung et al. (2017) reported a common pattern of high/moderate within-population genetic diversity for species native to the Baekdudaegan (He = 0.159, n = 16). Estimates of genetic diversity for the three stonecrops studied including S. polytrichoides are close to these values. In addition, the populations of all assessed plant species that occur within the study area harbor moderate to high levels of genetic variation within populations (with the single exception of Berchemia berchemiifolia) (Chang et al., 2003): Lilium cernuum (He= 0.161) (Chung et al., 2014a), and the congeneric Iris odaesanensis and I. rossii (He= 0.120 and He= 0.132, respectively) (Chung et al., 2015).
The significant deficit of heterozygotes within populations of S. polytrichoides, S. kamtschaticum, and H. ussuriense (multi-population FIS= 0.331, 0.272, and 0.246, respectively) (Table 1) is likely caused by non-random mating among relatives. If the three species are self-incompatible (we believe so because Crassulaceae are usually self-incompatible) (Thiede and Eggli, 2007), biparental inbreeding (that is generated by limited pollen and/or seed dispersal) and a Wahlund effect may account for this deficit of heterozygotes.
Effect of physical barriers on genetic differentiation
As predicted, the degree of genetic differentiation among populations of S. polytrichoides is moderate (FST = 0.250) and fall within the range of the other Sedum/Hylotelephium species that co-occur in the study area (0.261 in H. ussuriense and 0.165 in S. kamtschaticum) (Chung et al., 2014b). These values are somewhat higher than those reported for short-lived herbaceous perennials (Nei’s GST = 0.233) (Hamrick and Godt, 1990) and species with mixed-animal breeding system (GST = 0.216) (Hamrick and Godt, 1990). Compared to these, our estimates are surprisingly high, given the close distances between populations of the three species in the study area (range ca. 0.13–14.27 km). Again, however, we have to note that the review by Hamrick and Godt (1990) demonstrated that about 47% of the variation in GST values among populations is explained by life-history traits.
Results from STRUCTURE analysis for S. polytrichoides exhibit the existence of two roughly differentiated clusters: populations from the northern valleys (Juwang and Jeolgol valleys) on the one hand and those from the southern valleys (Okgye and Haok valleys) on the other hand (Fig. 2B). The same pattern (northern valleys vs. southern valleys) of genetic clustering was also found for H. ussuriense (Fig. 3 in Chung et al., 2014b) but not for S. kamtschaticum, for which genetic segregation of northern vs. southern valleys is much less apparent (Fig. 3 in Chung et al., 2014b). Similarly to STRUCTURE, AMOVA shows a much higher between-region (i.e., northern valleys vs. southern valleys) component in S. polytrichoides and H. ussuriense (24% each) relative to S. kamtschaticum (9%; Table 3). This genetic divide is also evident from the distribution of exclusive alleles: Idhb and Lap-2b for the northern valleys and Dia-2a, Fec, 6Pgdc, and Pgm-2c for the southern valleys in S. polytrichoides (Table 2); Dia-2b, Dia-2c, Fea, Fed, Mec, 6Pgdb, Pgm-1b, and Pgm-2a for the northern valleys in H. ussuriense (Appendix S1 in Chung et al., 2014b). Notably, some of these private alleles occurred at high frequencies, which are indicative of low gene flow rates (Slatkin, 1985). In contrast, only three alleles were exclusive for the northern valleys in S. kamtschaticum (Mea, Pgm-2d, and Tpi-2b) which, in addition, occurred at very low frequencies (well below 0.100) (Appendix S2 in Chung et al., 2014b). Thus, a strong barrier for gene flow can be hypothesized between Jeolgol and Okgye valleys—which are separated by ca. 8 km—for two of the species (H. ussuriense and S. polytrichoides). This stretch comprises some relatively high mountains (including Mujangsan and Byeolwabi peaks, of over 600 m a.s.l.) (Fig. 1), and multiple ravines and valleys, delineating a highly dissected terrain. The total lack of intervening populations for H. ussuriense (and almost total for S. polytrichoides) would have made these 8 km insurmountable for the natural dispersal of the two stonecrops, whereas the more or less continuous occurrence of S. kamtschaticum would have ensured a high degree of genetic cohesion.
The AMOVA reveals that barriers for gene flow, in contrast, seem not to be very strong between the two northern (i.e., Juwang and Jeolgol) valleys (except for S. polytrichoides, with a percent variation of up to 10%) and also between the two southern (Okgye and Haok) valleys (Table 3). The lack of apparent barriers for gene flow between Okgye and Haok valleys for the three species is an expected result as the populations are relatively continuously distributed along two converging streams (Fig. 1); indeed, and according to Ku et al. (2011), populations of H. ussuriense would have once constituted a single, continuous population that was fragmented as a result of human activities (mainly road construction). The two northern valleys are separated by less than 4 km, a physical but not a genetic barrier for all the species with the relative exception of S. polytrichoides. Why S. polytrichoides, even having a few intervening populations, show larger genetic differentiation between the two northern valleys than H. ussuriense is an intriguing question that could be related to differences in historical gene flow between the two species (e.g., occurrence of fewer in between populations in the northern valleys in the past compared to the present).
In sum, we chose three species (nearly congeneric) in JNP and its vicinity which have different distribution patterns (higher abundance and more continuous distribution in S. kamtschaticum relative to S. polytrichoides and H. ussuriense). We showed that there was a difference in the genetic structure among the three species based on the population genetic analyses using allozyme polymorphism, which seems to be primarily due to the differences in the distribution of the three species within the study area (rather than differences in pollination, seed dispersal mechanisms or some other unknown factors). More importantly, the present study demonstrates that relatively small-scale physical barriers to gene flow—even of only few km— have a considerable effect on genetic structure pattern of plant species.