


INTRODUCTION
Saussurea dorogostaiskii Palib. (Asteraceae) is one of the rare and threatened plants among the genus Saussurea DC. This species grows on the alpine talus of the southern Siberian to northern Mongolian mountains at altitudes from 1,500 to 2,750m a.s.l. (Von Raab-Straube, 2017; Norris, 2020; Baasanmunkh et al., 2022). In general, S. dorogostaiskii resembles S. orgaadayi Khanm. & Krasnob. and S. involucrata (Kar. & Kir.) Sch.Bip, but can be distinguished by its elongated racemiform synflorescence, oblong-elliptic to obovate leaves, and purple corolla (Von Raab-Straube, 2017). All species are referred to as ‘snow lotus’ in traditional medicine. Saussurea dorogostaiskii has long been used to treat lung diseases, cough, and cold symptoms (Krasnoborov, 1984; Norris, 2020). Recently, this species has been classified as critically endangered globally, with the area of occupancy is estimated at 68 km2 (Nyamgerel et al., unpubl. data) but the species population size over time is undocumented. This situation requires immediate action to sustainably manage its natural populations by developing and adapting appropriate conservation strategies.
Biodiversity conservation approaches focus on the geographic areas, ecosystems, ecological communities, and species, with less attention on genetic diversity and the evolutionary change among populations. Indeed, most conservation studies used species as a metric for biodiversity, focusing on intraspecific units within intensively managed threatened species (Coates et al., 2018). Intraspecific variation can determine the adaptive potential of species and influence its persistence over time (Barrett and Schluter, 2008). Most recent studies of plant species variation have identified high levels of diversity using DNA fingerprinting techniques (Godhe and Rynearson, 2017).
Inter simple sequence repeats (ISSR) markers are widely used DNA-based marker for population genetic studies because it generates more reliable and reproductive bands, as a compared than random amplification of polymorphic DNA (RAPD) (Nagaoka and Ogihara, 1997; Zhang and Dai, 2010). ISSR are technically simpler compared to simple sequence repeats and amplified fragment length polymorphism markers since they do not require prior sequence information to generate DNA application products (Joshi et al., 2000; Bornet and Branchard, 2001; Wang et al., 2008). Recently, ISSR markers are used to determine genetic variability and population relationship of plant species such as Prangos fedtschenkoi (Regel & Schmalh.) Korovin (Mustafina et al., 2017), Etlingera elatior (Jack) R.M.Sm. (Ismail et al., 2019), Mallotus oblongifolius (Miq.) Mull.Arg. (Yan et al., 2019) and Eleusine coracana (L.) Gaertn. (Venkatesan et al., 2021).
The genetic variability in Saussurea genus has been successfully investigated using genetic markers (Yuan et al., 2009; Gailīte et al., 2011; Jeong et al., 2012; Kreuzer et al., 2014; Dashzeveg et al., 2017; Sharma et al., 2019; Semwal et al., 2020; Yun and Kim, 2021). However, studies on genetic variation of S. dorogostaiskii are not studied to date. Therefore, the present study aimed to assess the genetic diversity and differentiation of S. dorogostaiskii in northern Mongolia using the ISSR markers. The knowledge of genetic variation will be helpful in the development of S. dorogostaiskii conservation strategy.
MATERIAL AND METHODS
Sampling
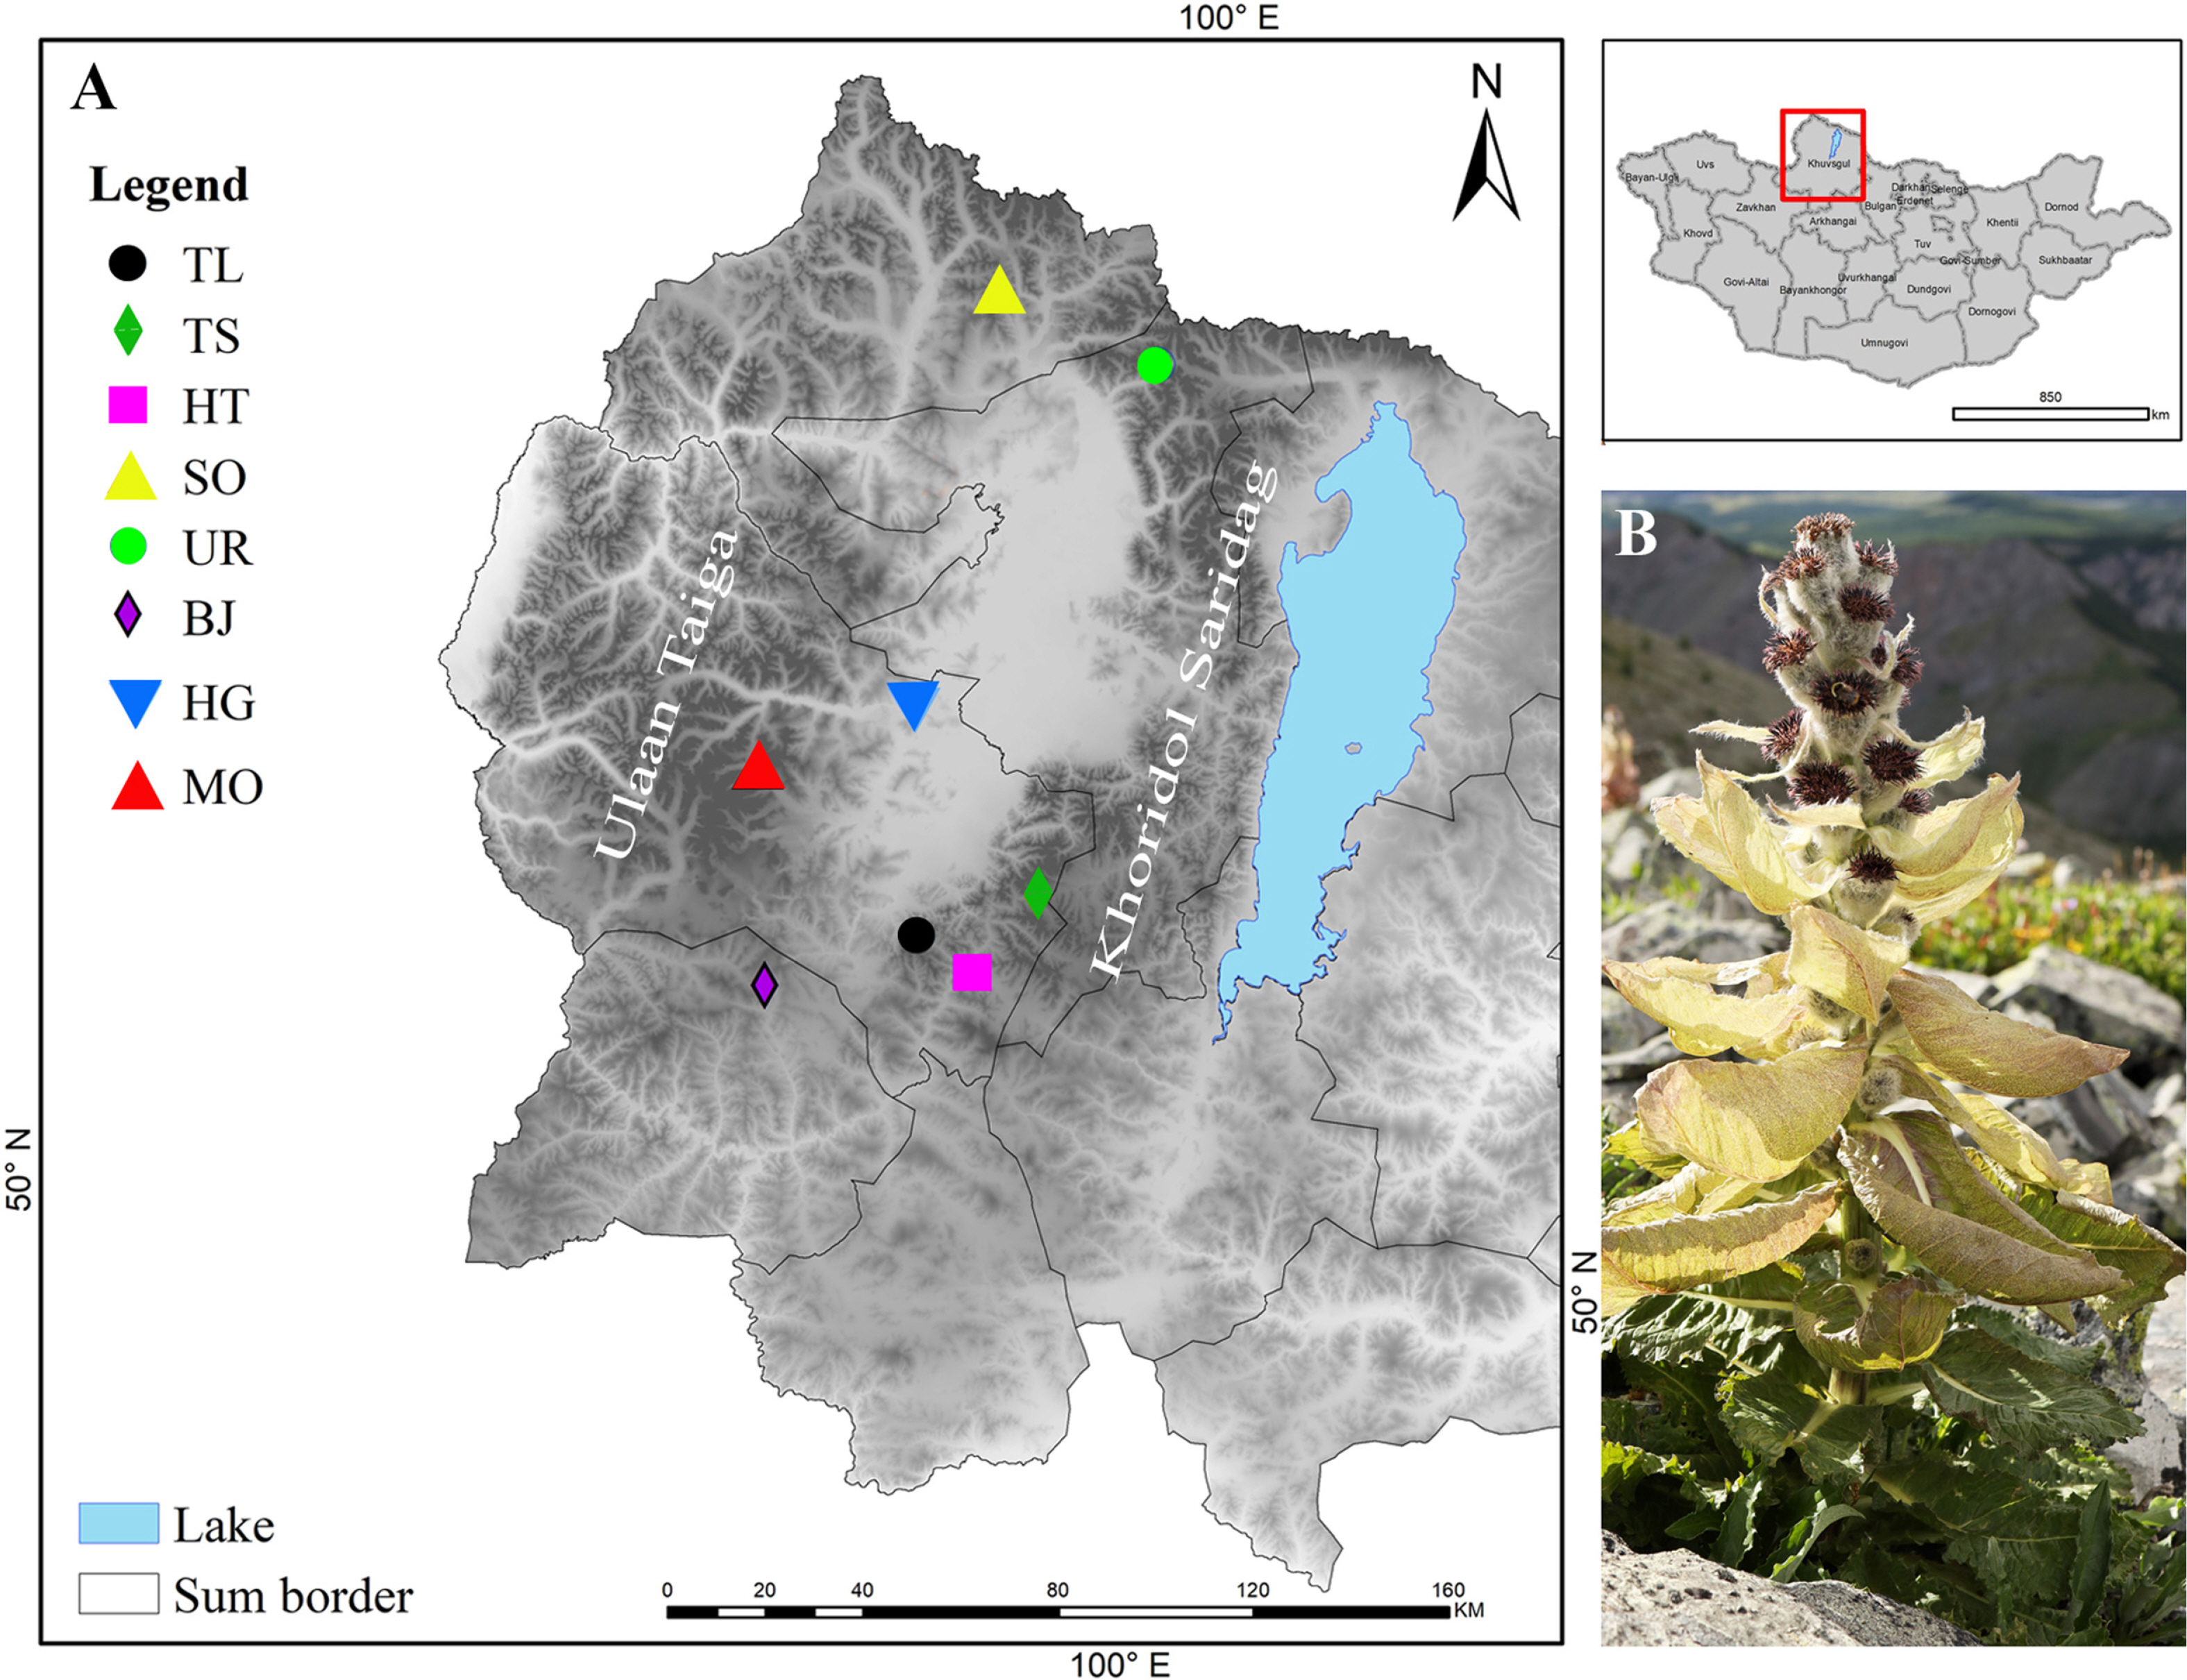
A total of 70 samples of S. dorogostaiskii from eight populations were collected from three isolated mountains in Khuvsgul province, namely, the Khoridol Saridag, Ulaan Taiga and Tengis-Shishget (Fig. 1A). Samples from protected areas were collected with permissions and supports from the relevant authorities. All individuals sampled within each population were separated by at least 10 m to avoid collecting individuals connected by a rhizome. Seven to ten individuals were randomly collected from each population due to its limited population size. The voucher specimens were deposited at the Herbarium of the National University of Mongolia (UBU). Detailed information on each population is given in Table 1.
DNA extraction and PCR amplification
Genomic DNA from the silica-gel-dried leaves was isolated by the CTAB methods (Doyle and Doyle, 1987). The quality and quantity of the genomic DNA were measured with spectrophotometry using a BioPhotometer (Eppendorf AG, Hamburg, Germany), and the integrity of the DNA was checked visually by ethidium bromide staining of a 0.8% agarose gel. DNA samples were diluted to a concentration of 50 ng/μL using a TE buffer. A total of 100 ISSR primers were initially screened with one individual from each population for reproducible amplification. Genetic profile study of S. dorogostaiskii was conducted by five ISSR primers, the remaining primers showed no amplification. Selected primers produced distinct and well-resolved fragments, which enable effective scoring for genetic diversity study within and among the populations.
The DNA amplifications were carried out in 50 μL volumes consisting of 2.0 μL DNA; 25 μL AmpliTaq Gold 360 Master Mix (Thermo Fisher Scientific Ltd., Waltham, MA, USA); 4 μL primer (800 nM); and the final volume was completed with ultrapure water. The PCR amplification was performed in a thermal cycler under the following conditions: initial denaturation at 94oC for 5 min; 35 cycles of 15 s at 94ºC for denaturation, 30 s at 47ºC for primer annealing and 2 min at 72ºC for extension, with a final extension for 5 min at 72ºC. The PCR products were separated by horizontal electrophoresis in agarose gel (2.0% w/v) immersed in a 1× TAE (Tris-Acetate-EDTA) buffer at constant voltage (150 V) for approximately 1 h and then stained with 0.5 μg/mL ethidium bromide. The DNA bands were then visualized with UV light and documented manually.
Data analysis
Distinct, reproducible fragments were scored as present (1) or absent (0) for each ISSR-PCR reaction and presented as part of a binary matrix. The number of total bands (TB), the number of polymorphic bands (PB), and the percentage of polymorphic bands were obtained. The following parameters were used to measure the efficiency of ISSR markers for genetic profile assessment. The polymorphic information content (PIC) is the potential of a primer to detect the polymorphism among individuals in the population, and it is calculated for each primer as described by Roldán-Ruiz et al. (2000): PICi = 2fi (1-fi), where PICi is the PIC of the locus i, fi is the frequency of the amplified allele, and 1-fi is the frequency of the non-amplified allele. The frequency was calculated as the proportion between the number of amplified alleles at each locus and the total number of accessions. The PIC of each primer was calculated using the average PIC value from all loci of each primer. The general usefulness of the markers used was determined by the marker index (MI) for each ISSR primer. The MI for each primer was calculated as the product of the PIC and effective multiplex ratio (EMR) according to Varshney et al. (2007); MI = PIC × EMR. The EMR is influenced by the overall utility of each marker, it was estimated as EMR = n × β, where n is the average number of the alleles amplified by accession to a specific system marker (multiplex ratio) and β was estimated after considering the number of polymorphic loci (PB) and the non-polymorphic loci (MB); β = PB/(PB + MB). The resolving power (RP) is the ability of the primer to differentiate between genotypes, which was calculated as RP = ΣIb, where Ib represents the informative bands (Prevost and Wilkinson, 1999). The Ib can be represented into a 0/1 scale by using the following formula: Ib = 1 – (2 × |0.5 – pi|), where pi is the ratio of accessions comprising the ith band.
Genetic parameters such as the observed number of alleles (Na), the effective number of alleles (Ne), the Shannon’s information index (I) and the genetic diversity or expected heterozygosity (H), were determined with GenALEx version 6.5 (Peakall and Smouse, 2012). Genetic divergence between populations was investigated by total genetic diversity (HT), genetic diversity within populations (HS), Nei’s (1978) genetic differentiation index among populations (GST), and gene flow estimates between populations (Nm) with POPGENE version 1.31 (Yeh et al., 1991).
An analysis of molecular variance (AMOVA) was performed to estimate the partitioning of genetic variation within and among populations using GenALEx 6.5 (Peakall and Smouse, 2012). A study on the correlation (Mantel test) between the genetic and geographic distance among the populations using XLSTAT software (Addinsoft, 2021). The unbiased genetic distance was utilized for the construction of a dendrogram using unweighted pair group method with arithmetic mean (UPGMA) in POPGENE program version 1.31. In addition, Nei’s genetic distance matrix was used to construct a Neighbor-Joining dendrogram, using XLSTAT, for the 70 individuals belonging to the eight populations of S. dorogostaiskii. Also, the principal coordinate analysis (PCoA) was also performed using XLSTAT to determine the relative genetic distance between individuals and to check the consistency of population genetic differentiation as defined by cluster analysis.
RESULTS
ISSR marker analysis
Five primers that displayed clear and reproductive bands were obtained through the screening of a total of 100 primers. A total of 53 amplified ISSR fragments (loci) were found from 70 S. dorogostaiskii samples with 96.4% polymorphism and an average of 10.6 loci by primer. The band’s range was from 150 bp to 1,000 bp. The information on the genetic profile of each sample obtained using the five ISSR primers was used to estimate marker performance using the following parameters (Table 2). A high PIC value was detected for primer UBC891 at 0.41 and a low PIC value of 0.17 for UBC810. The average PIC value per primer is 0.24. The maximum EMR (7.52) was detected with the primer UBC855 and the lowest was shown by the primer UBC840 (1.18), with a mean EMR of 5.14 per primer. The average MI was 3.04 per ISSR primers. The highest MI value was detected with the primer UBC810 (4.44) and the lowest with UBC840 (1.5). The average RP was 5.75 per ISSR primer. The highest RP value was detected with the primer UBC836 (9.28), and the lowest with the primer UBC855 (1.94).
Genetic diversity
Estimates of genetic diversity parameters varied among S. dorogostaiskii populations (Table 3). The percentage of polymorphic loci for each population ranged from 0.30% (HG; Mt. Khug, Ulaan Taiga, Ulaan-Uul) to 0.60% (UR; Mt. Urtrag, Khoridol Saridag, Renchinlkhumbe) with an average of 0.46%. The UR population included the highest number of effective alleles per locus (1.40) and the lowest alleles were observed in the HG population (0.85). The UR population from the Khoridol Saridag Mountains proved to be the most genetically diverse (I = 0.33, H = 0.23), while the HG population from the Ulaan Taiga Mountains had the lowest (I = 0.16, H = 0.11) of all populations. The average genetic diversity of S. dorogostaiskii was low (I = 0.25, H = 0.17).
Genetic differentiation
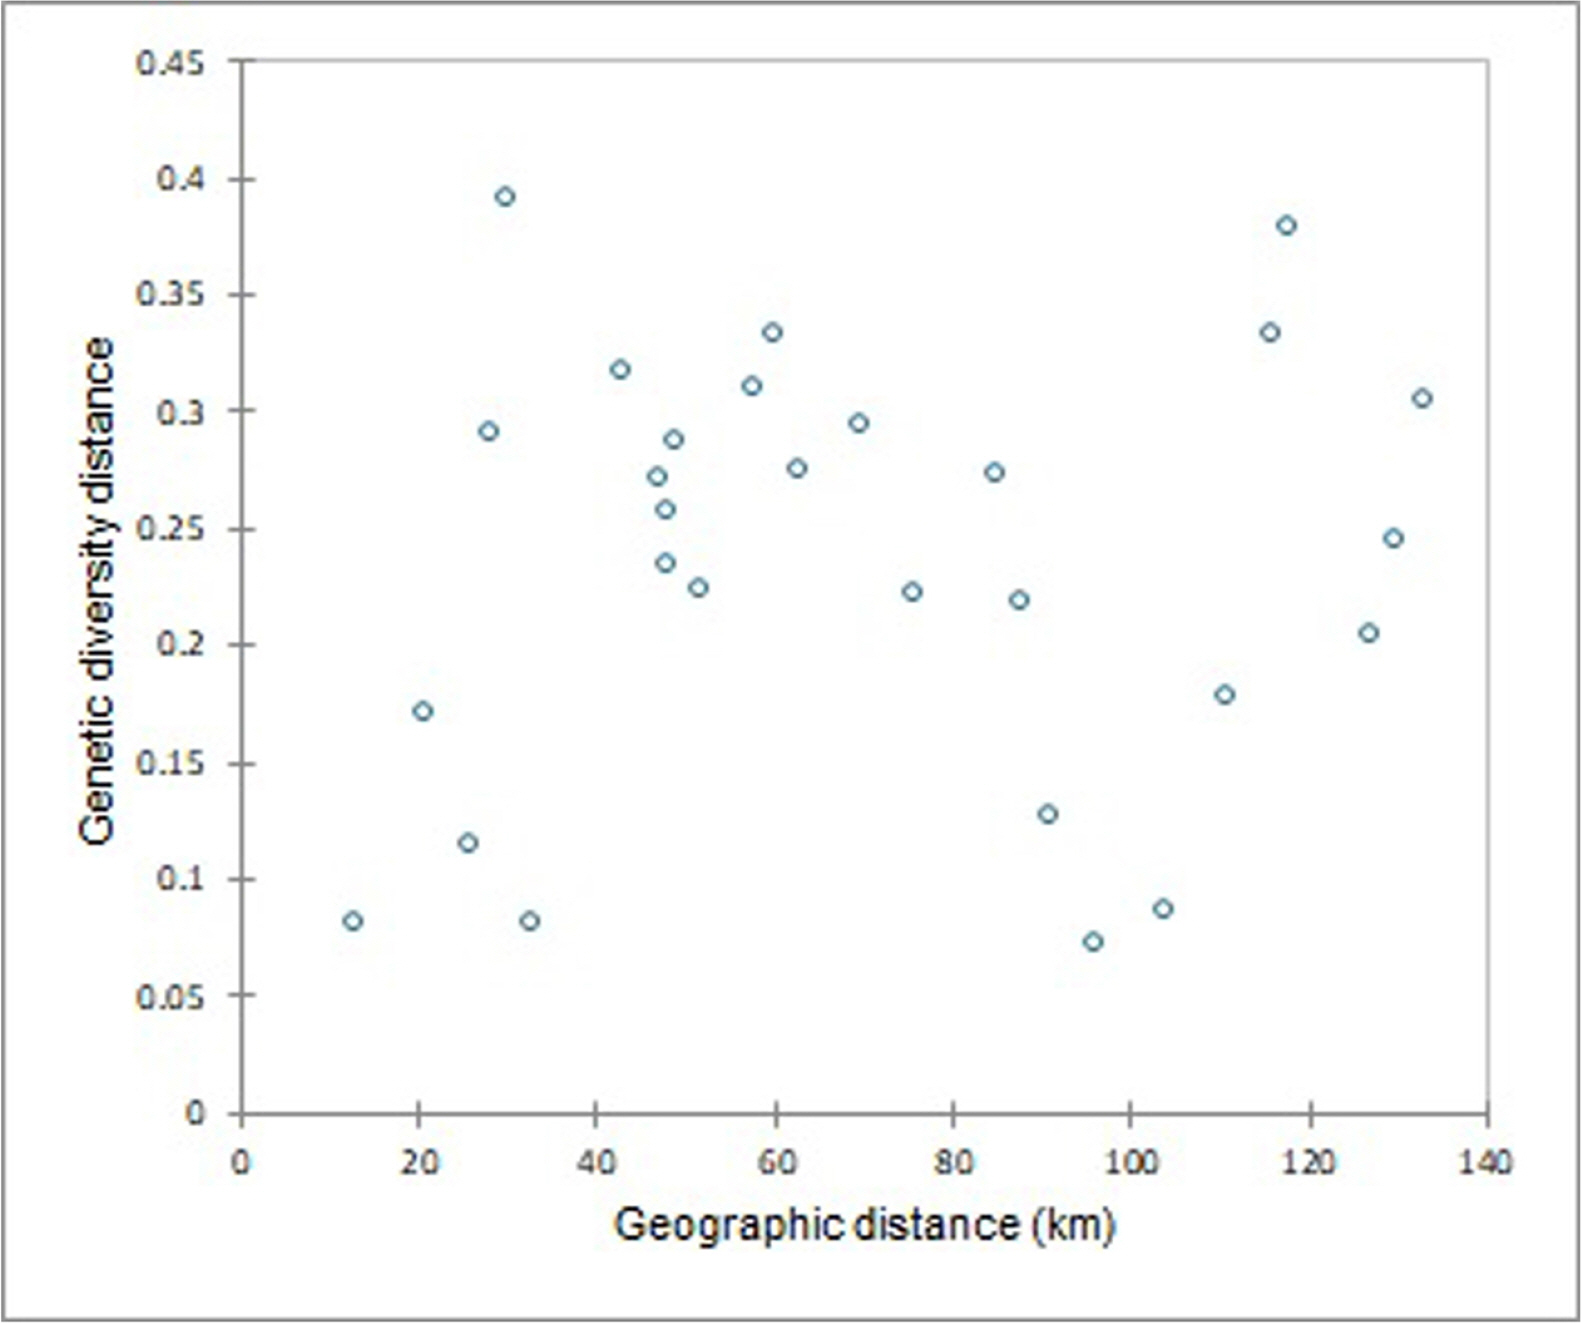
AMOVA revealed a statistically significant difference (p < 0.01) in variance among eight populations of S. dorogostaiskii. Of the total genetic diversity, 22% occurred among regions, 32% among populations, and 46% within populations (Table 4). The additional genetic differentiation parameters support AMOVA result (Table 5). The genetic diversity within populations (HS = 0.16) was equal to half of the total genetic diversity (HT = 0.32). The observed genetic differentiation among populations (GST) was 0.49 demonstrating that 49% of genetic variation is among the populations. This result was further substantiated by the low level of gene flow among the populations, as showed by the low Nm value (0.51). The mantel test showed no significant correlation between population genetic differentiation and geographical distance (r = 0.098, p = 0.632) (Fig. 2). This indicates that genetic variation among S. dorogostaiskii is not limited by the remoteness of populations.
Relationship among populations
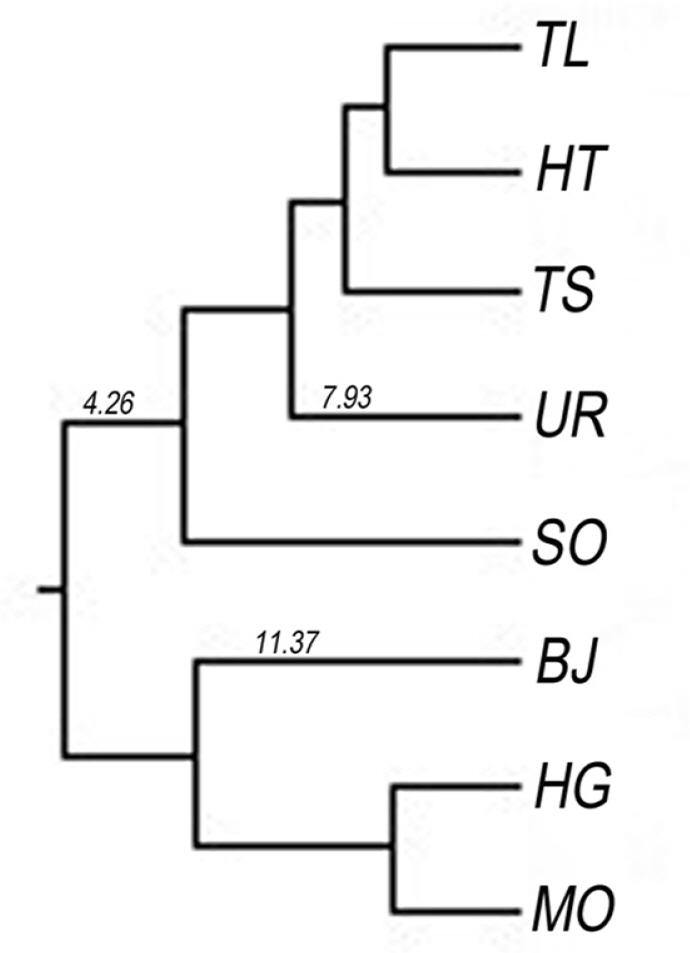
The pairwise genetic distance and genetic identity among eight populations of S. dorogostaiskii ranged from 0.008 to 0.40 and 0.67 to 0.92, respectively (Table 6). The maximum genetic distance was observed between BJ (Mt. Baruun Jarga, Ulaan Taiga, Bayanzurkh)–UR pair. The least genetic distance was found in TL (Mt. Tag, Khoridol Saridag, Ulaan-Uul sum)–HT (Mt. Khorin, Khoridol Saridag, Renchinlkhumbe) and MO (Mt. Mongorog, Ulaan Taiga, Ulaan-Uul)–HG pairs. The dendrogram of the eight populations of S. dorogostaiskii was based on the genetic distances of Nei’s using UPGMA cluster analysis (Fig. 3). UPGMA analysis separated out two main clusters. Cluster I included TL, TS (Mt. Toshin, Khoridol Saridag, Renchinlkhumbe), HT, and UR collected from the Khoridol Saridag Mountains, and SO (Mt. Soyo, Tenger Shishget, Tsaaannuur) from the Tengis-Shishget Mountains. Cluster II was from the HG, MO, and BJ from Ulaan Taiga Mountains.
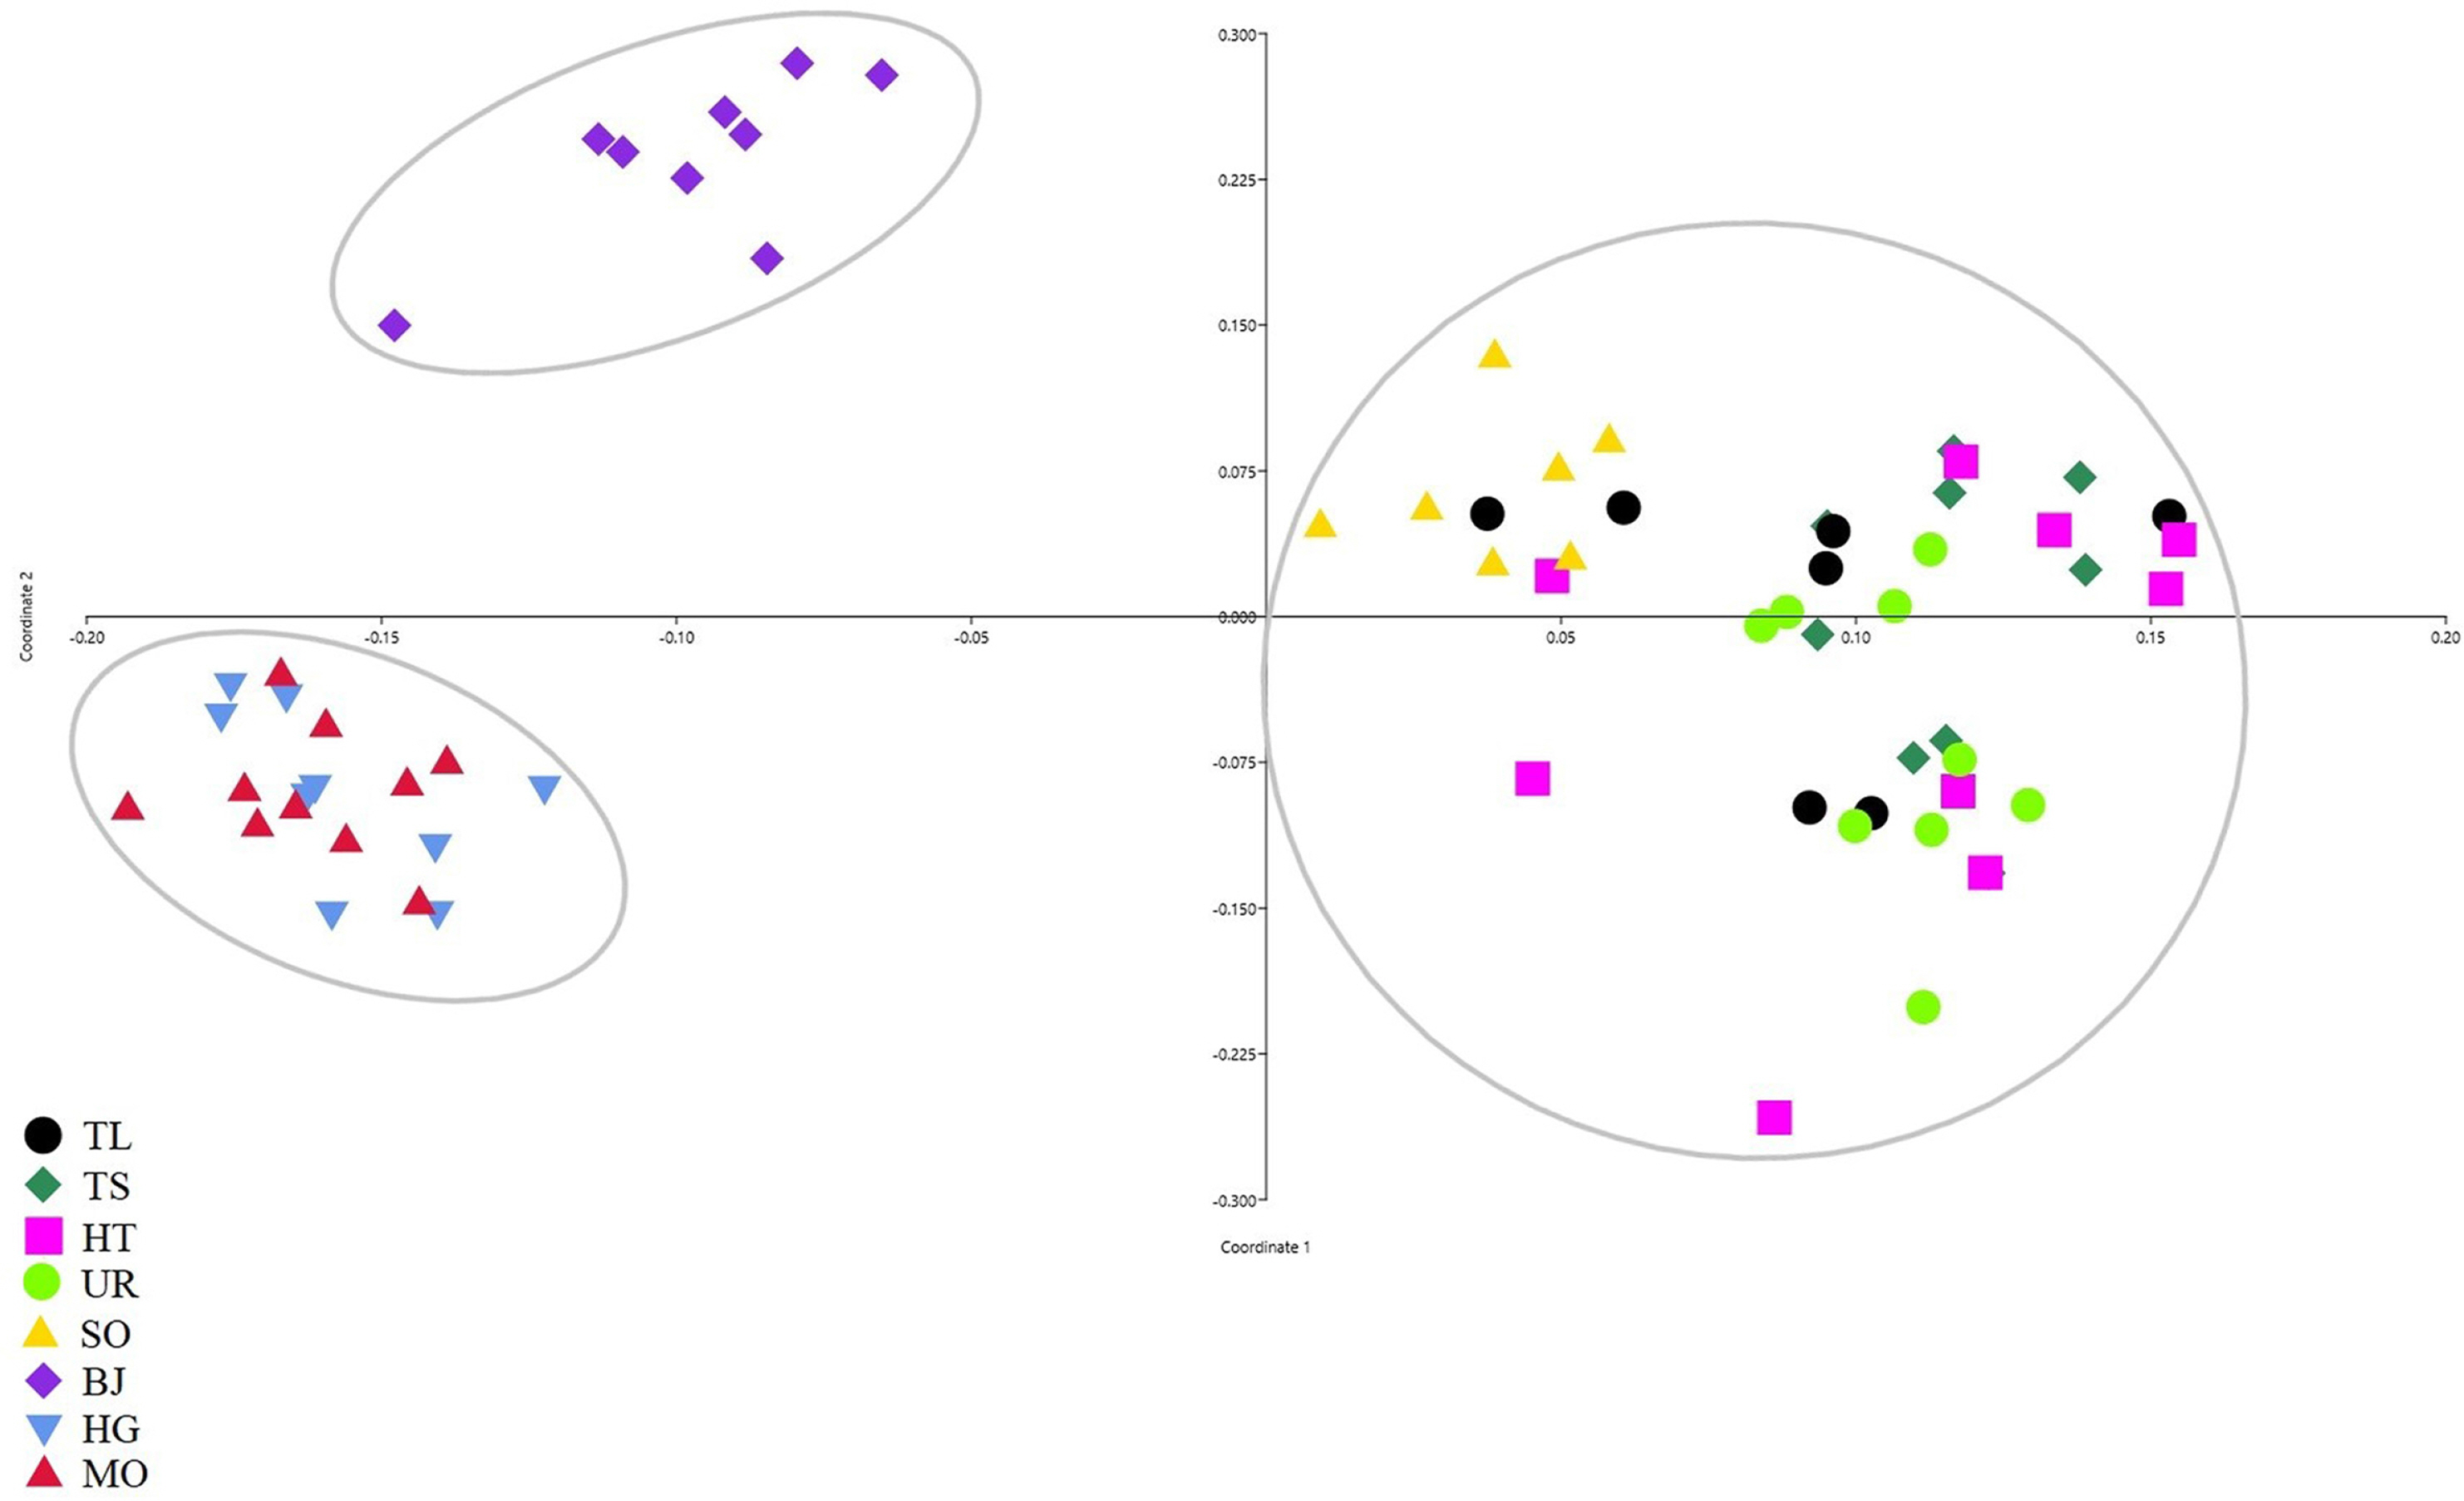
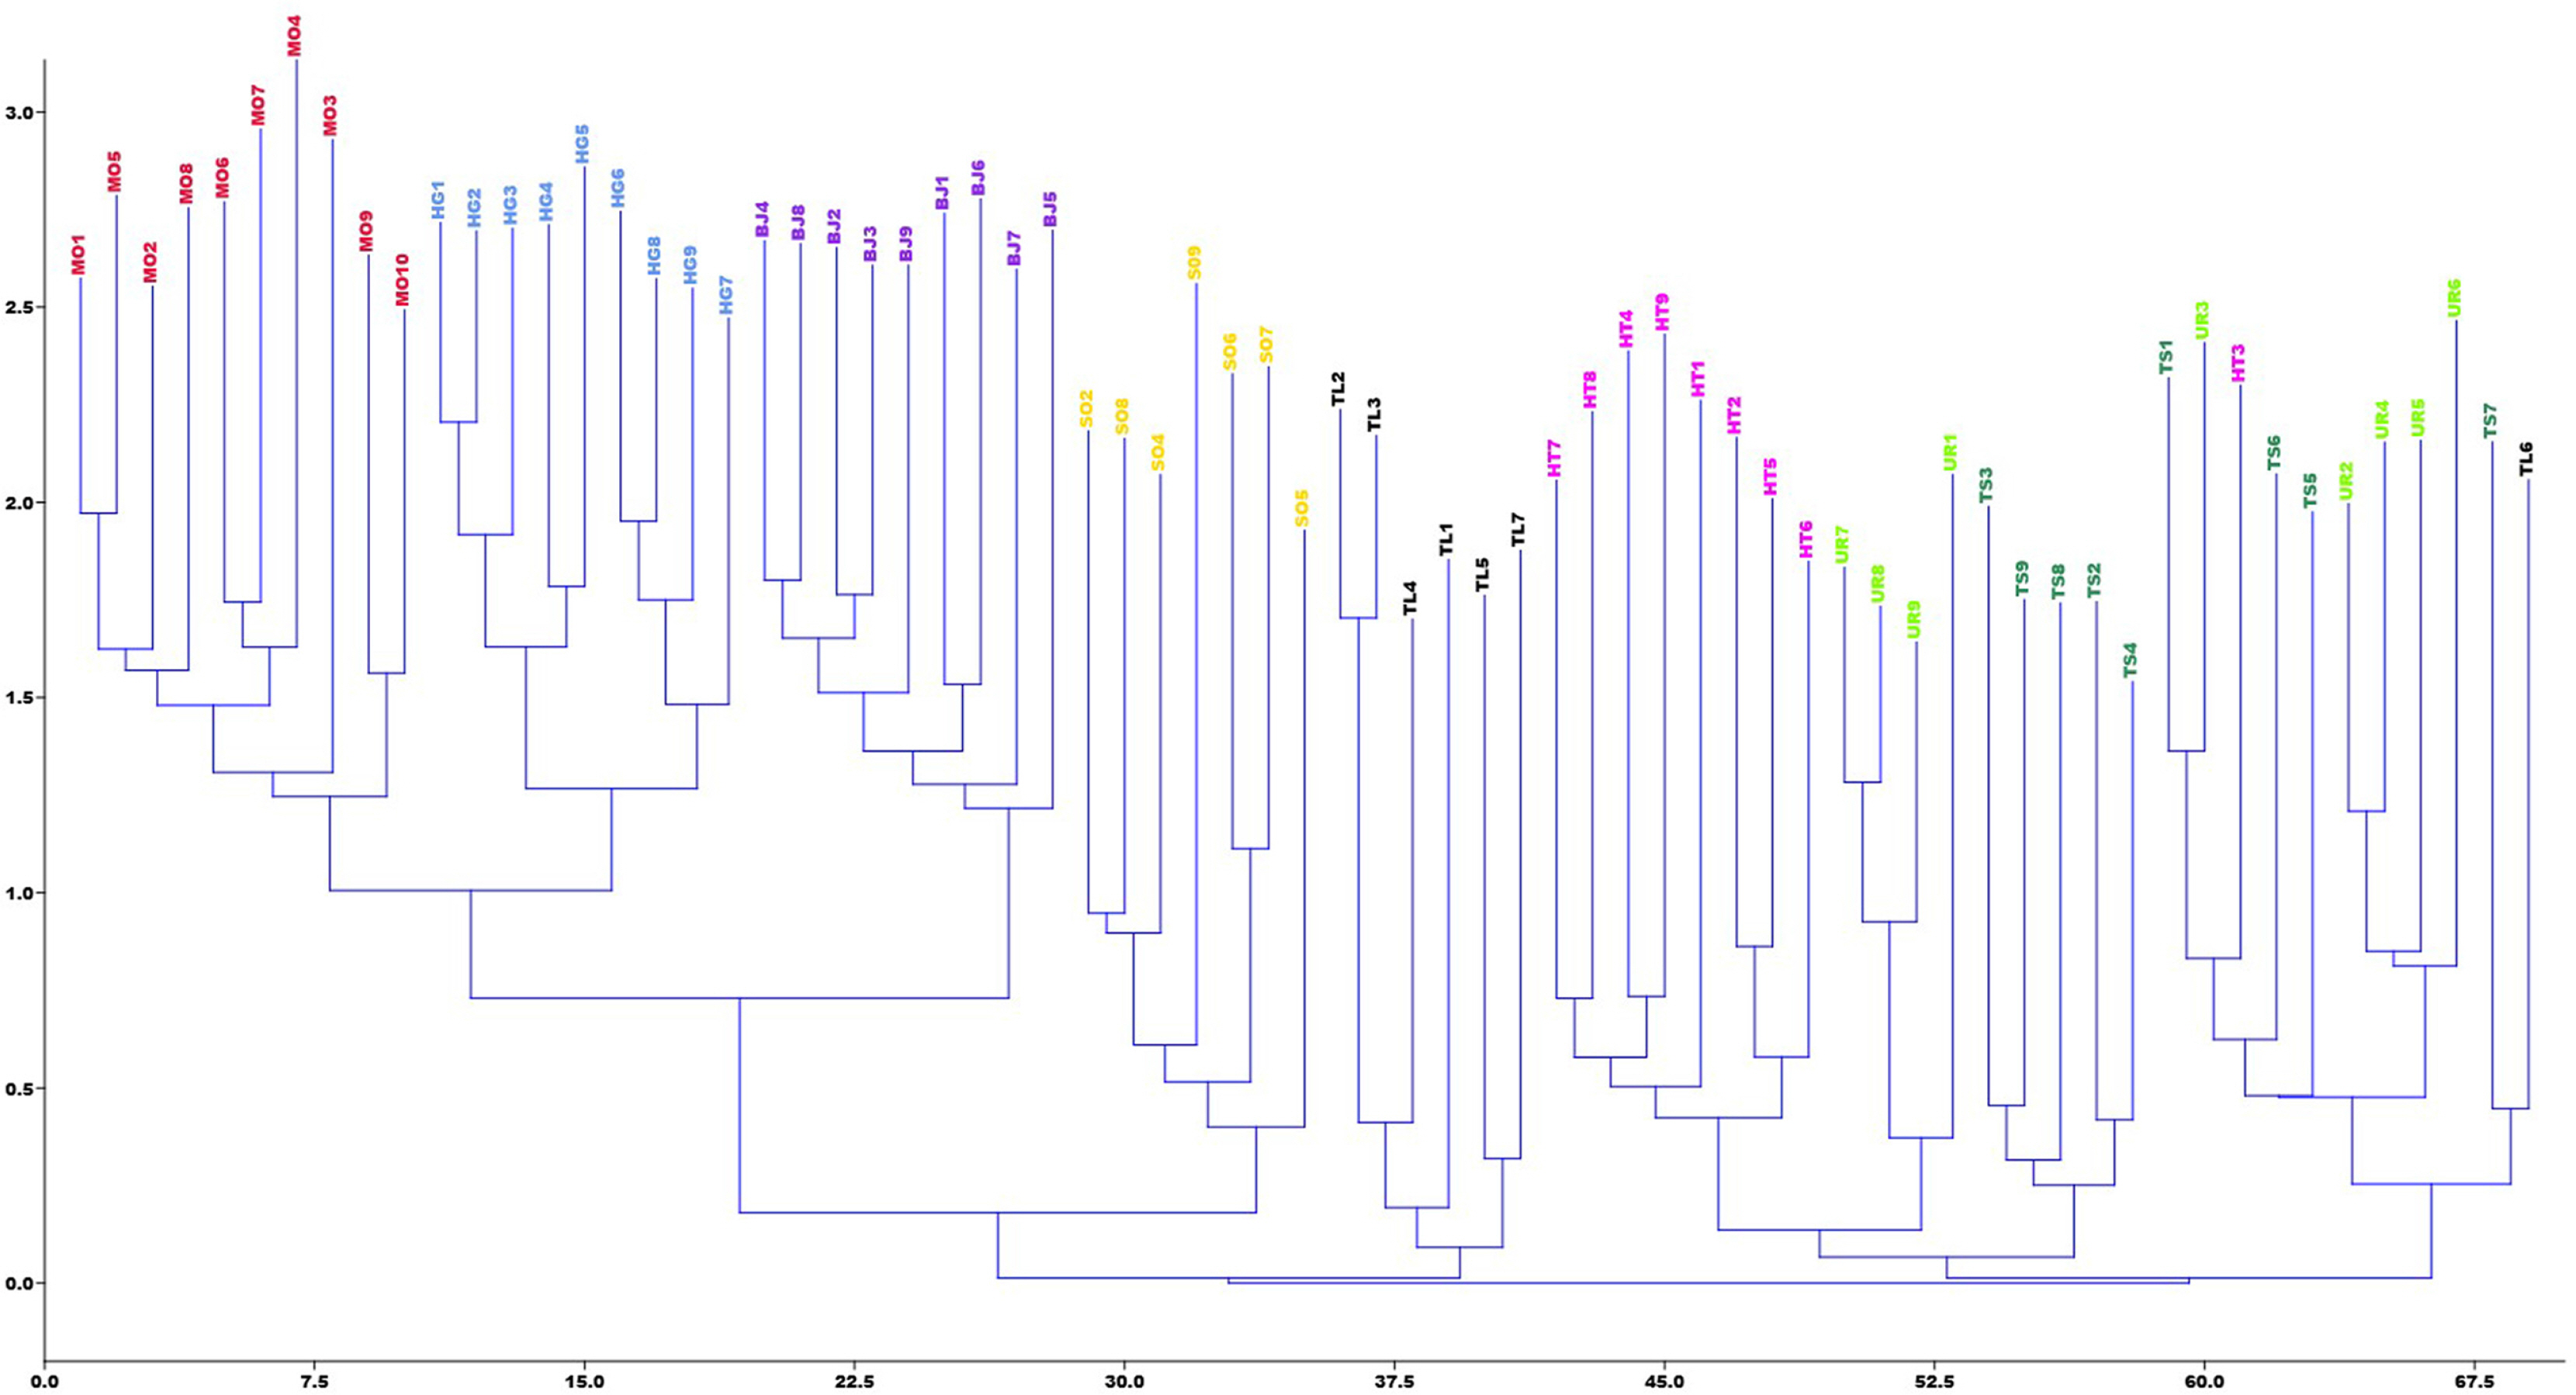
PCoA was obtained for the individuals and the differentiation was divided into three main clusters (Fig. 4): Cluster 1 included populations TL, TS, HT, and SO, consistent with cluster I of the UPGMA analysis; Ulaan Taiga Mountains populations were divided into Cluster 2 (HG and MO) and Cluster 3 (BJ). The Neighbor-Joining tree for individuals based on Nei’s genetic distance showed that most individuals from the same population origin were formed together (Fig. 5). However, the individuals from the Khoridol Saridag Mountains were formed in partially mixed clusters. Additionally, the SO population of the Tengis-Shishget region is more similar to the populations of the Khoridol Saridag Mountains than to the populations of the Ulaan Taiga Mountains.
DISCUSSION
The primary goal in conserving endangered plant species is maintaining genetic diversity (Margules and Pressey, 2000). The S. dorogostaiskii, a globally threatened species, has low genetic diversity, which was similar to the previous findings in the Saussurea genus that also used the ISSR markers (Jeong et al., 2012; Semwal et al., 2020). In addition, the average genetic diversity of S. dorogostaiskii was lower (H = 0.17, I = 0.25) than the short-lived perennial plants (H = 0.32) and endemic species (H = 0.20) estimated using RAPD markers (Nybom, 2004). The proportion of genetic diversity within the populations was low in S. dorogostaiskii (46%) compared to most Saussurea species (59–92%) (Gailīte et al., 2011; Jeong et al., 2012; Kreuzer et al., 2014; Dashzeveg et al., 2017; Semwal et al., 2020; Yun and Kim, 2021).
Genetic diversity within the population is influenced by many factors such as population size, breeding system, natural selection, and life history traits (Li et al., 2018). Previous studies reported that S. dorogostaiskii is a monocarpic perennial that reproduces exclusively by seed; it has been found with more rocks and less vegetation cover in the middle elevation of mountains up to 2,735 m, with a relatively low number of mature individuals (Von Raab-Straube, 2017; Norris, 2020). In addition, Boikov (2009) discovered that S. dorogostaiskii, as a rare plant species adapted to ecological stress conditions in Siberia, is not very competitive, grows slowly, and prefers an open canopy area. For a species already low in number, these traits of reproducing slowly and in highstress niche environments, indicate that gene flow would be limited. In our findings, the gene flow (Nm) between S. dorogostaiskii populations was 0.51. Generally, Nm < 1 is insufficient to counteract the effects of genetic drift (Hamrick et al., 1995). Genetic drift affects the distribution of genetic variation in two ways: (1) the decrease of variation within populations (loss of heterozygosity and eventual fixation of alleles), and (2) the increase of differentiation among populations (Ellstrand and Elam, 1993). Additionally, we calculated the GST values to define genetic differences among populations. This value is often very low, but statistically significant, it is classified as low (< 0.05), medium (0.05–0.15), or high (> 0.15) (Li et al., 2018). S. dorogostaiskii populations have a high level (0.49) of differentiation, which occurs when gene flow between populations is restricted.
Looking at the clustering of population genetics can help reveal what important factors restrict gene flow. In this study, all Ulaan-Taiga populations formed one cluster, and other populations formed a second main cluster. The Tengis-Shishget Mountains is linked by connecting terrain and proximity to the northern edge of the Khoridol Saridag Mountains. This connection explains why the SO population is more genetically alike to the Khoridol Saridag populations than the Ulaan-Taiga populations. The Ulaan Taiga and Khoridol Saridag Mountains are separated by the Darkhad Depression (Fig. 1A) (Clark, 2014), is a significant area and entirely different ecosystem which could limit gene exchange between S. dorogostaiskii populations. This trend of genetic isolation among snow lotus species similarly occurred at high elevations in China (Chen and Wang, 2018). These species are distributed in the Tianshan Mountains and the Altai Mountains, which are separated by the Junggar Basin. Furthermore, the BJ population is genetically differentiated from the other two populations in the same area. This difference may be because the BJ population is located in very different ecological conditions, e.g., in a canyon on the top of a mountain range, and that this population had only three adults and less than 50 individuals. In small populations (e.g., < 100 individuals), allele frequencies may undergo large and unpredictable fluctuations due to random genetic drift (Barrett and Kohn, 1991).
In the natural populations of S. dorogostaiskii, significant loss of genetic diversity within the populations due to genetic drift caused by small population sizes, ecological stress conditions and geographical isolation in northern Mongolia. The population is the fundamental unit of species evolution, low genetic diversity within-population may reduce adaptability to changing environments (Li et al., 2018). Therefore, the protection of all existing populations is necessary, required to maintain genetic variability and protect it particularly in the face of alpine climate change. Furthermore, continuing studies will require assessing the genetic diversity in southern Siberian S. dorogostaiskii populations and comparing them to northern Mongolian populations to see if these patterns of genetic diversity and isolation are similar.
Most populations of S. dorogostaiskii are found in federally protected areas and harvesting is prohibited by law in Mongolia. However, because it grows at high altitudes in vast areas (approximately 1,528,000 hectares), rangers have rarely been able to enforce this law and catch the harvesters (Norris et al., 2020). Harvesting during the flowering season is reported to be a significant cause of S. dorogostaiskii endangerment. According to this previously mentioned study, the most effective ways to protect S. dorogostaiskii are to educate locals about its rarity and threats, increase safeguarding time during the flowering season, and consider community cultivation programs for the species harvest. Furthermore, harvesting of the Himalayan snow lotus correlated with decreased plant height and status over a 100 years period. This situation suggests that humans can unconsciously drive evolution by selecting the largest individuals for harvest; this behavioral pattern, should be considered when managing threatened species (Law and Salick, 2005).
CONCLUSION
This is the first study to consider the genetic profile of S. dorogostaiskii in northern Mongolia. The ISSR markers revealed relatively lower genetic diversity for S. dorogostaiskii than for other Saussurea species and rare medicinal plants. This species has quite low diversity within the population and high genetic differentiation among the populations. This is likely because, the populations of S. dorogostaiskii are affected by genetic drift due to high elevation isolation and the expanse of the Darkhad Depression. Therefore, all populations of S. dorogostaiskii equally warrant an active conservation strategy to maintain their natural diversity. However, forthcoming studies with genome wide genotyping-by- sequencing (Elshire et al., 2011) or MIG-Seq (multiplexed ISSR genotyping by sequencing) (Suyama and Matsuki, 2015) will be valuable in better understanding of the genetic diversity and distribution patterns of S. dorogostaiskii with related Saussurea species known as Snow Lotus group.