한국산 붉은대극(대극과) 집단의 유전적 변이와 분화
Genetic variation and differentiation among populations of Euphorbia ebracteolata (Euphorbiaceae) in Korea
Article information
Abstract
한국산 붉은대극 9집단에 대해 전분전기영동법을 이용하여 10개의 동위효소 유전자 좌위를 조사하였다. 붉은대극 집단은 기존의 대극속 식물과 비교해 볼 때 상대적으로 높은 집단 내 유전적 변이(A = 2.2, P = 61.1, He = 0.165)와 낮은 집단 간 분화(FST = 0.075) 양상을 보여주었다. 붉은대극에서 나타나는 이와 같은 높은 집단 내 유전적 변이는 이들이 갖고 있는 오래 생존하고, 지역적으로 분포하며, 타가수분에 의존하는 생식특성으로 설명할 수 있다. 한국산 붉은 집단에서 보여주는 매우 낮은 유전적 분화와 독특한 대립인자가 나타나지 않는 특징은 이들 집단이 최근에 분화되었을 가능성을 시사하며, 동위효소 자료로 볼 때, 기존에 기재된 종하분류군인 풍도대극(var. coreana)과 설악대극(for. magna)은 붉은대극 한 종으로 통합하는 것이 적절한 것으로 추정된다.
Trans Abstract
Using starch gel electrophoresis, ten isozyme loci were examined in nine populations of Euphorbia ebracteolata in Korea. Populations of E. ebracteolata tend to have higher within-population levels of genetic variation (A = 2.2, P = 61.1, He = 0.165) along with low levels of genetic differentiation (FST = 0.075) compared to previously reported Euphorbia species. The relatively high genetic variation in E. ebracteolata may be due to its long-lived regional distribution and to the outcrossed nature of the species. Low levels of genetic differentiation and the absence of unique alleles in E. ebracteolata populations suggest that Korean populations diverged recently. This study does not support the recognition of var. coreana and for. magna as separate taxa, and suggests that they should be combined with E. ebracteolata.
The unique patterns of genetic variation in the species are produced by interactions among several common traits which are prevalent in closely related species. Especially, life history characteristics are strongly associated with their patterns of the genetic variation (Hamrick, 1989). In case of within populational variation, perennial plants which are widespread, outcrossing, long-lived and wind-pollinating showed higher levels of genetic variation than species with different combination of traits (Hamrick et al., 1991). Besides, the levels of genetic diversity among populations are known to be strongly influenced by their breeding systems and seed dispersal mechanisms (Hamrick et al., 1991; Loveless and Hamrick, 1984).
In recent reviews of allozyme data in Korean native Euphorbia species, high levels of genetic diversity within and among populations were maintained in most species (Park, 2004). This is in general agreement with previous studies in that plants with wide distribution, long-lived, outcrossed and explosive seeds should have high genetic variation within population (Loveless and Hamrick, 1984). It is also consistent with the past researches in that species with explosive seeds maintain significant amount of genetic differentiation among populations (Loveless and Hamrick, 1984). Meanwhile, recent study of E. ebracteolata using six Korean populations (Park et al., 1999) showed that very low levels of genetic differentiation were maintained among populations.
Euphorbia ebracteolata Hayata, a regional species in Far East Asia, is distributed in coastal areas of Korea. Most natural populations of the species show a patchy distribution at the rocky and sunny slopes of mountain edge along the streams (Ahn et al., 1996; Lee, 2010). Morphologically, E. ebracteolata is recognized by the purple leaves at early stage of growth, and tuberous rhizome with yellow sap. Phylogenetically it is closely related to E. pallasii, but distinguished by having alternate leaf arrangement.
Hayata (1904) described E. ebracteolata based on the specimen collected at Hokkaido in Japan, and later, Hurusawa (1940) proposed E. ebracteolata var. coreana based on the specimen collected at Pung-do, Ansan City, which had hair within its cyathium. Recently, Lee (1998) recognized specimen collected at Mt. Seorak as a for. magna based on the leaf characters. However, recent study on Korean Euphorbia (Park, 2007) did not recognize infra-specific taxa, and treat them as only E. ebracteolata. Species concept in E. ebracteolata complex has been studied based on the diverse molecular data. Phenolic compound data (Ahn et al., 1995) did not support the recognition of E. ebracteolata var. coreana. However, isozyme studies generally supported the status of var. coreana (Park et al., 1999).
As in other Euphorbia species, E. ebracteolata is an insect pollinated, and outcrossed species. The inflorescenses are visited by various insects from Hymenoptera, Diptera, Heteroptera and Lepidoptera (Lee, 2010).
In this study we investigated genetic variation among E. ebracteolata populations in Korea, and compared to previously reported allozyme data from native Korean Euphorbia species.
Materials and Methods
A total of 220 individuals from nine South Korean populations of Euphorbia ebracteolata were examined with starch gel electrophoresis (Table 1). For running the gels, fresh leaf samples were ground using extracting buffers containing 0.1 M tris-HCl, pH 7.5, 1 mM EDTA, 10 mM MgCl, 10 mM KCl, 14 mM 2-mercaptoethanol, and 5 mg/ml solid polyvinylpyrrolidone (Gottlieb, 1981). Three whatman chromatography paper wicks were dipped into each individual, and stored at −70°C in a refrigerator.
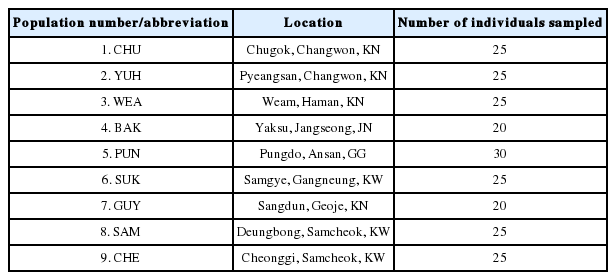
Locality and number of individuals collected from nine populations of Euphorbia ebracteolata examined in this analysis.
The Buffer systems and electrophoresis conditions followed in those described in Park (2004). System I was used to resolved malate dehydrogenase (MDH), 6-phosphogluconate dehydrogenase (6PGD), isocitrate dehydrogenase (IDH), and shikimate dehydrogenase (SKDH). Three enzymes were assayed using system II: aspartate aminotransferase (AAT), phosphoglucose isomerase (PGI), and glutamate dehydrogenase (GDH).
The BIOSYS-1 program (Swofford and Selander, 1981) were used to calculate mean number of alleles per locus (A), percentage of polymorphic loci (P), mean observed heterozygosity (Ho), and expected heterozygosity (He) within the populations studied. For the analysis of population structure, Wright’s (1965) F-statistics were calculated. The F statistics include FIS, an index of inbreeding, FIT, the overall inbreeding coefficient, and FST, a measure of the genetic differentiation among populations. Fixation indices (F) were calculated as a measure of inbreeding, and a Chi-square test was conducted to test for significant deviations from Hardy-Weinberg (HW) expectation. BIOSIS-1 was used to calculate Nei’s (1972) genetic identity values among populations, and resulting data were used to produce UPGMA phenogram.
Results
Ten loci coding for seven enzymes were scored from nine populations of E. ebracteolata. Only one locus was scored in most of enzymes except for GDH (3 loci) and PGI (2 loci). All of the loci were polymorphic, and high frequency alleles were shared by all populations in E. ebracteolata (Table 2).

Summary allele-frequency data for ten polymorphic loci among nine populations of Euphorbia ebracteolata in Korea.
The mean number of alleles per locus (A) ranged from 1.7 to 2.5, with the lowest being population 7 (GUY). The proportion of polymorphic loci in a population (P) ranged from 40.0 to 80.0 with a mean of 61.1. The mean observed proportion of heterozygous loci in a population (Ho) ranged from 0.060 in GUY to 0.219 in PUN, whereas the mean expected proportion of heterozygous loci (He) ranged from 0.075 in GUY to 0.261 (PUN) (Table 3).
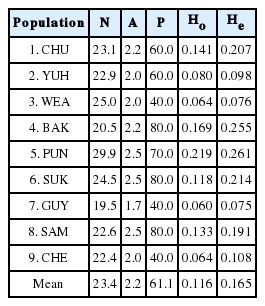
Summary of allozyme variation for nine populations of Euphorbia ebracteolata: sample size (N), mean number of alleles per locus (A), percentage of polymorphic loci (P), mean observed heterozygosity (Ho), and mean expected heterozygosity (He).
Statistical difference of the fixation index from 0 calculated by the chi-square test showed that among the 78 valid tests 55 showed accordance to H-W proportions while 23 cases were significantly different from the equilibrium (Table 4, asterisks). Among the valid cases 59% (46/78) had a negative value, and it revealed that not all of the loci showed any significant heterozygote deficiency in E. ebracteolata populations.

Value of the fixation index F for polymorphic loci in populations of Euphorbia ebracteolata. Consistency with Hardy-Weinberg equilibrium, i.e., statistical difference of fixation indices from 0, were evaluated using chi-square analysis and is indicated via asterisks: *P<0.005.
The mean FIS and FIT values of ten loci of E. ebracteolata studied were 0.278 and 0.332, which indicated a deficiency of heterozygotes compared to the H-W expectation (Table 5). The mean value of FST in ten loci of E. ebracteolata was 0.075, which is the lowest value of previous Korean Euphorbia species studied (Table 6).
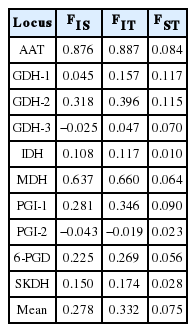
Summary of F-statistics at 10 loci from nine populations of Euphorbia ebracteolata. FIS, an index of inbreeding, FIT, the overall inbreeding coefficient, and FST, a measure of the genetic differentiation among subpopulations.
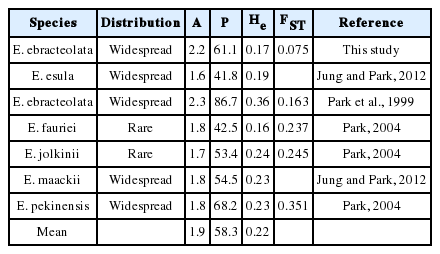
Comparison of genetic diversity data for Euphorbia ebracteolata and other Euphorbia species in Korea compiled from the literature.
The Nei’s (1972) genetic identity among nine E. ebracteolata populations ranged from 0.975–1.000, which indicates that nine populations studied were apparently close to each other. The UPGMA phenogram based on genetic identity value revealed that there was no relationship between geographical distance and genetic identity value. And the Pungdo (PUN) population was the most distantly related among populations in E. ebracteolata (Fig. 2).
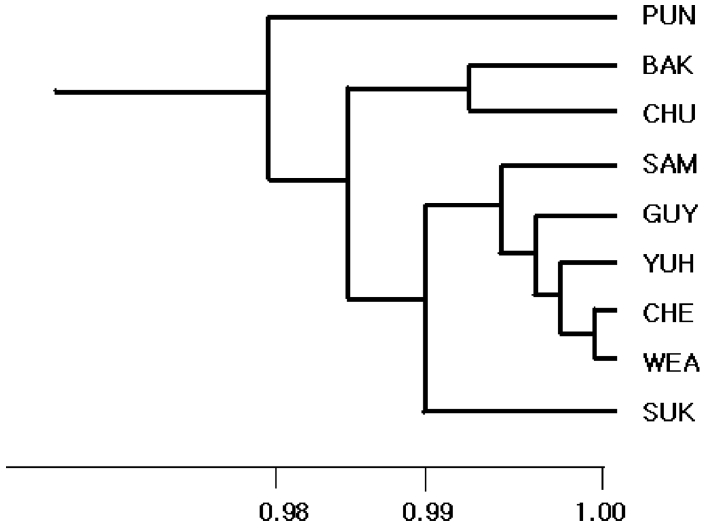
UPGMA phenogram based on the Nei’s (1972) genetic identity for nine populations of Euphorbia ebracteolata in Korea.
Discussion
In comparison with Euphorbia species available, the Korean populations of E. ebracteolata tend to have higher levels of genetic variation than those of previously reported Euphorbia species (A = 1.53, P = 36.65, He = 0.15) (Park, 2004). Even when only comparing to Korean Euphorbia species, the estimates of genetic variation in E. ebracteolata are higher than those of Korean species except for the value of He (Table 6, A = 1.9, P = 58.3, He = 0.22).
High genetic variation in E. ebracteolata is also strongly expected by comparing to compiled data of species with similar life history characteristics (Loveless and Hamrick, 1984; Hamrick et al., 1979, 1991). They proposed that species with life histories and ecological variables such as regional distribution (A = 1.85, P = 55.96, He= 0.185), long-lived perennial (A = 2.07, P = 65.77, He= 0.267), outcrossed mating system (A = 1.85, P = 51.07, He= 0.185), wind pollination (A = 2.27, P = 57.45, He= 0.264), and seed dispersal by wind (A = 1.86, P = 44.91, He= 0.188) had higher genetic variation within populations than those with other combinations of life histories and ecological characteristics.
Euphorbia ebracteolata is long-lived, sexually reproducing and outcrossing species with regional distribution in Korea, northern Japan and eastern China. The flowers are visited by various flies and bees (Lee, 2010), and seeds are dispersed in explosive manner. Plants of E. ebracteolata usually inhabit rocky areas along the creeks at the edges of forest. This relative high genetic variation in E. ebracteolata may be due to its long-lived, regional distribution, and outcrossed nature of the species. Besides, its preference of habitats probably suggest a possibility of secondary seed dispersal by water.
In comparison with other Euphorbia species, E. ebracteolata is unusually very low in genetic differentiation. FST value of E. ebracteolata is the lowest among Euphorbia species (0.163–0.785) studied until now. Even among the Korean Euphorbia species (0.163–0.351), E. ebracteolata has a significantly low genetic differentiation, and it also shows a possibility of extensive gene flow among populations. However, in the case of Euphorbia in general, dispersal of seeds mainly involve explosion of fruits. Consequently, it becomes very likely that seeds germinate near the parents. Thus, majority of species have characteristics of high genetic differentiation among populations (Park, 2004). An exceptional case where a very low genetic differentiation was found in E. ebracteolata is explainable by the presence of secondary seed dispersal via water. The fruits of E. ebracteolata may travel a long distance by water streams, and this is strongly supported by the presence of the patchy populations along the forest edges through the creek areas. One alternative hypothesis for the low levels of genetic differentiation and the absence of unique alleles in E. ebracteolata populations is the recent divergence of Korean populations.
After Hayata (1904) described E. ebracteolata in Japan, Hurusawa (1940) proposed a new variety, E. ebracteolata var. coreana, a plant having hairs within the cyathium found in Pung-do in Korea. Recently, Lee (1998) added a for. magna based on the leaf characters from Mt. Sulak. All of the populations we studied shared high frequency alleles at most loci, and they did not have any unique allele to recognize infra taxa. Thus, allozyme data did not support the recognition of var. coreana and for. magna.
Low levels of genetic differentiation, and the absence of unique alleles in E. ebracteolata populations suggest a recent divergence of Korean populations.
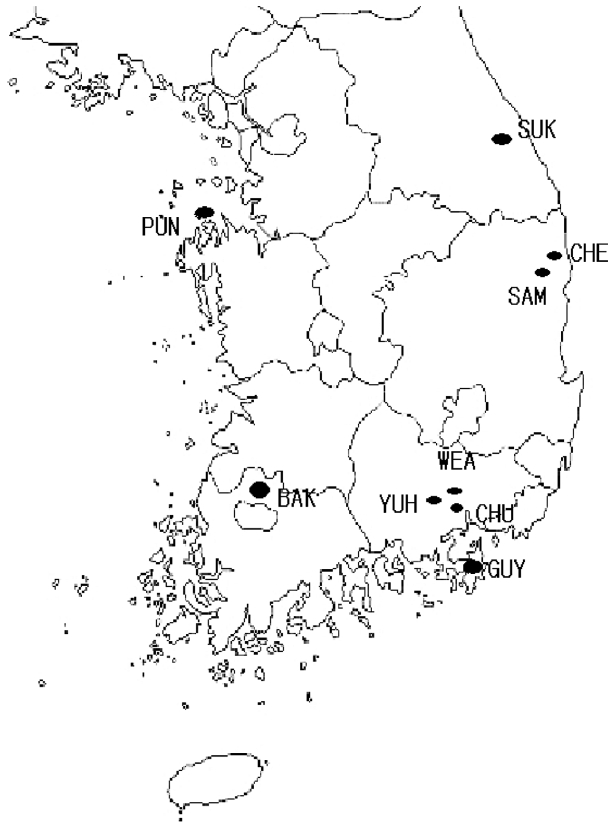
Geographic distribution of nine South Korean populations of Euphorbia ebracteolata.