Development of EST-SSR markers for the Korean endemic species Chrysosplenium aureobracteatum (Saxifragaceae)
Article information
Abstract
Chrysosplenium aureobracteatum Y. I. Kim & Y. D. Kim (Saxifragaceae) is a recently described endemic species growing in the central part of the Korean peninsula. It requires constant monitoring for conservation due to its limited distributions. There is also a need for molecular markers for proper assessments of the genetic differentiation of C. aureobracteatum from species morphologically similar to it. In this study, we developed microsatellite markers that can be used to evaluate the genetic diversity of this species, representing fundamental data with which to conserve the natural populations of the species. A total of 17 expressed sequence tag–simple sequence repeat (EST-SSR) markers were developed by the Illumina pair-end sequencing of the transcriptomes of C. aureobracteatum. These markers were successfully applied to populations of C. aureobracteatum and to its most closely related species, C. barbatum, revealing high polymorphism in both species. The EST-SSR markers developed in this study were proven to be useful not only to monitor the population genetic structure of C. aureobracteatum for conservation purposes but also to study the genetic delimitation of the species from species closely related to it.
Chrysosplenium aureobracteatum Y. I. Kim & Y. D. Kim (Saxifragaceae) is a recently described species only growing in the central part of the Korean peninsula (Kim and Kim, 2015). The recognition of the species as a separate taxon has long been hampered due to the lack of prominent diagnostic traits during the flowering period, causing many researchers to misidentify it as either C. barbatum Nakai, C. fulvum A. Terracc., or C. sphaerospermum Maxim. (Kim, 2014). Kim and Kim (2015) noted the shape of the leaves on the sterile stems which developed after the flowering period as the most reliable diagnostic character for the above species, which are morphologically very similar to each other (Hara, 1957).
C. aureobracteatum requires constant monitoring in terms of conservation due to its limited distribution only in northeastern Gyeonggi-do and northwestern Gangwon-do in South Korea. Genetic diversity data of populations is used as a key component for the establishment of conservation plans for rare endemic species (Solórzano et al., 2016; Jung et al., 2018). Although the species is well segregated from taxa closely resembling it in the internal transcribed spacer phylogeny (Kim, 2014), population genetic data would be important for understanding the evolutionary history and for clarifying the taxonomic delimitation of these species. Expressed sequence tag–simple sequence repeat (EST-SSR) markers developed from the RNAs of the expressed genes have relatively conservative characteristics (Ellis and Burke, 2007; Hu et al., 2011), making them useful not only for population genetic studies but also for investigations of the evolutionary relationships among closely related species (Balbino et al., 2019). In this study, EST-SSR markers based on the transcriptome data of C. aureobracteatum were developed to evaluate the genetic diversity of this newly described species.
Materials and Methods
RNA was extracted from the fresh leaves of an individual of Chrysosplenium aureobracteatum plant sampled from Gwangdeoksan Mt. (Voucher No. KYI_2014358) (Table 1) using a RNeasy Plant Mini Kit (Qiagen, Valencia, CA, USA). The extracted RNA was used for a cDNA synthesis using a TruSeq cDNA Library Prep Kit, version 2 (Illumina, San Diego, CA, USA). The synthesized cDNA library was used for Illumina Hiseq 100 bp paired-end de novo transcriptome sequencing. Raw reads acquired by RNA sequencing were subjected to quality checking and trimming using Trimmomatic 0.32 (Bolger et al., 2014). EST-SSR motifs were obtained from the trimmed data using the Trinity (Hass et al., 2013) and the MIcroSAtellite (MISA) identification tools (Thiel et al., 2003). Primer sets were constructed to amplify the selected EST-SSR motifs using the Primer3 program (Rozen and Skaletsky, 1999). EST-SSR candidate loci (markers) were selected based on the number of SSR motif repetitions (5–8 times), the PCR product size (100–300 bp), the coverage depth (20–110), and the primer annealing temperature (55–60°C).

Locality and voucher information for the Chrysosplenium aureobracteatum and C. barbatum populations examined in this study. Voucher specimens were deposited in the HHU.
The candidate EST-SSR markers developed from C. aureobracteatum were applied to its most closely related species, C. barbatum, to confirm and obtain markers exhibiting polymorphism in both species. We examined 20 individuals of Chrysosplenium aureobracteatum and C. barbatum for the marker evaluation and cross-specific amplification test. The voucher specimens were deposited in the HHU (Herbarium of Hallym University) in Korea (Table 1).
PCR for the selected loci was conducted using a mixture with a total volume of 25 μL consisting of 10× Ex Taq buffer at 2.5 μL (TaKaRa Bio Inc., Otsu, Japan), 2.5 mM dNTP at 2 μL, 10 pmol forward and reverse primer labeled with fluorescent dye (FAM, HEX, NED) each at 0.5 μL, template DNA (5–10 ng) at 2 μL, Ex Taq DNA polymerase at 0.12 μL and SIGMA free water using a GeneAmp PCR System 9700 thermocycler (Applied Biosystems Inc., San Diego, CA, USA). The PCR process was performed under the following conditions: pre-denaturation (98°C, 5 min), denaturation (95°C, 1 min), annealing (59°C, 1d min), and extension (72°C, 1 min 30 sec). After going through the above reaction 35 times, the final extension was processed (72°C, 10 min). The PCR products were electrophoresed at 110 V in 1.2% agarose gel for 90 min, stained with ethidium bromide, and confirmed using a UV illuminator. Alleles were identified with an ABI 3730XL (automated sequencer) equipped with the GeneScan 500 LIZ Size Standard (Applied Biosystems). Genotyping was performed using GeneMapper 3.7 (Applied Biosystems), and peaks were scored manually by visual inspections. The PCR products with sizes deviating from the expected size ranges (as estimated by the Primer3 program) were eliminated from the genotyping process. Finally, the resulting genotypes were encoded to calculate the number of alleles (A), the observed heterozygosity (Ho), and the expected heterozygosity (He) using the GenAlEx 6.5 (Peakall and Smouse, 2012).
Results and Discussion
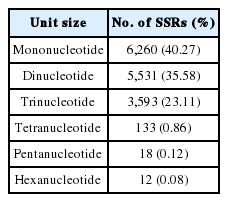
As a result of RNA sequencing, raw data of 8,486,210,570 bp were generated (GenBank BioProject number: PRJNA606349). The raw data were processed to produce 7,818,963,245 bp of trimmed data, with this data then utilized to produce a total of 70,753,963 bp of transcriptome data. A total of 15,547 SSR motifs were identified from the trimmed data. The identified SSR motifs consisted of 40% mono-nucleotides, 36% dinucleotides, 23% tri-nucleotides, and 1% tetra-, penta-, and hexa-nucleotides (Table 2).
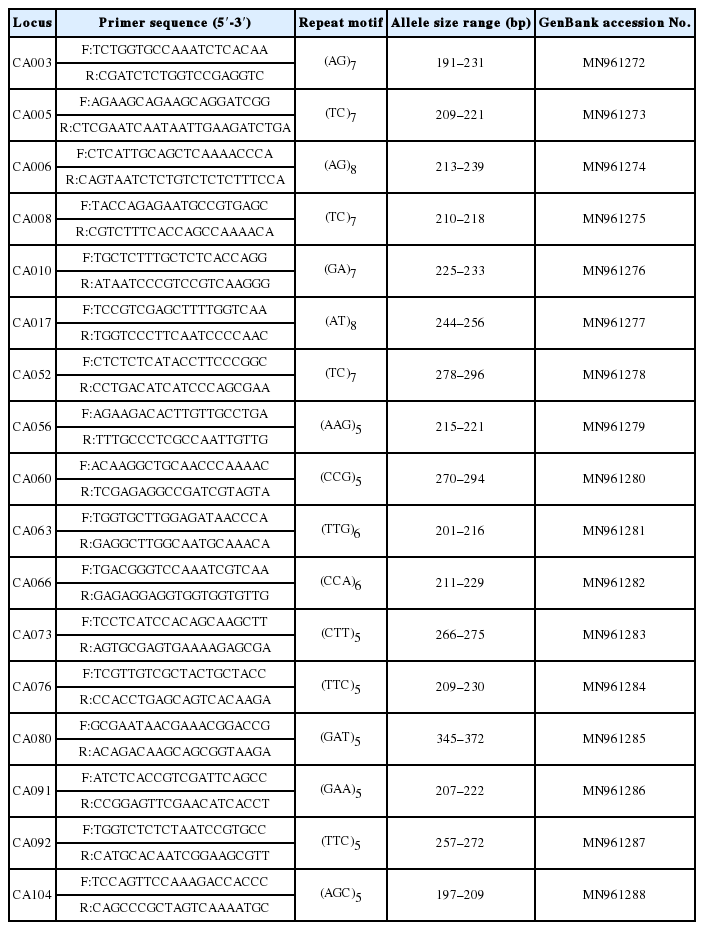
From the identified SSR motifs, 96 candidate markers were selected in consideration of the number of repetitions, the coverage depth, the annealing temperature, and the PCR product size. Excluding nonspecific bands with sizes deviating from the expected sizes, a total of 17 EST-SSR loci (markers) showing polymorphisms for Chrysosplenium aureobracteatum and C. barbatum were finally developed (Table 3).
As a result of applying the 17 EST-SSR markers on a population (with 20 individuals) of C. aureobracteatum, polymorphisms were detected from 11 markers, and a total of 33 alleles were identified (2 to 7 alleles depending on the polymorphic markers). The observed heterozygosity (Ho) and the expected heterozygosity (He) ranged from 0.000 to 0.750 and 0.000 to 0.543, respectively.
Cross-specific amplification for a population (with 20 individuals) of C. barbatum confirmed that 13 markers were polymorphic out of 15 amplifiable markers, resulting in a total of 47 alleles (2 to 8 alleles depending on the polymorphic markers). The observed heterozygosity (Ho) and the expected heterozygosity (He) ranged 0.000 to 0.850 and 0.000 to 0.779, respectively (Table 4).

Genetic diversity in Chrysosplenium aureobracteatum and C. barbatum based on 17 developed microsatellite markers (loci).
It is important to note that the six monomorphic markers in C. aureobracteatum (CA_005, CA_006, CA_010, CA_052, CA_066, CA_104) were highly polymorphic in C. barbatum. In contrast, the monomorphic markers for C. barbatum (CA_056, CA_073) exhibited polymorphism in C. aureobracteatum (Table 4). These results suggest that the EST-SSR markers developed for C. aureobracteatum are useful not only to examine the population genetic structure but also for species delimitation among related taxa.
Acknowledgements
This work was supported by a grant from the National Research Foundation of Korea (2015R1D1A1A01057163).
Notes
Conflict of Interest
Young-Dong Kim, a contributing editor of the Korean Journal of Plant Taxonomy, was not involved in the editorial evaluation or decision to publish this article. All remaining authors have declared no conflicts of interest.


